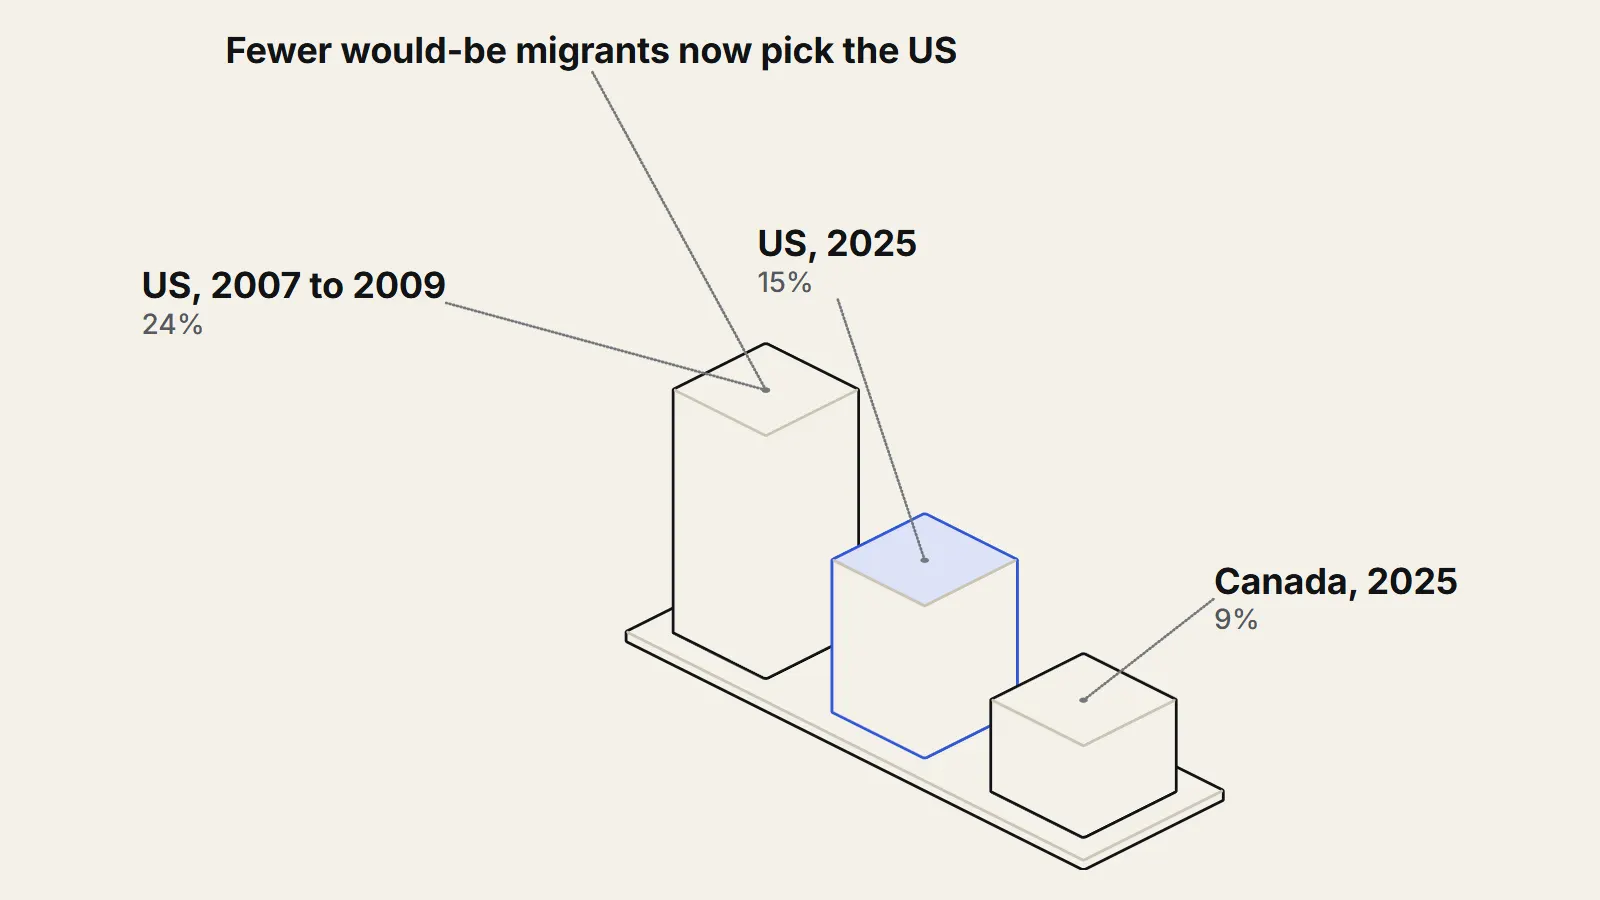
Fewer of the world's would-be migrants now want to move to the US. In its 2025 World Poll, published on 23 April 2026, Gallup found that 15 percent of adults who want to move permanently name the United States as their preferred destination1, the lowest share in nearly two decades of its surveys.1 This piece answers a news item that circulated this week (we saw it on 15 and 16 October 2026). It explains what the number measures, what moved it, and what it cannot tell us. It is not advice of any kind, and every figure comes from pages we opened: Gallup's report on the desire to move to the US (https://news.gallup.com/poll/708614/desire-migrate-drops-new-low.aspx) and the US Census Bureau's net international migration release (https://census.gov/newsroom/press-releases/2026/population-growth-slows.html).
How many people want to move to the US, and how did Gallup ask?
Gallup asks adults in each country one question, almost every year: "Ideally, if you had the opportunity, would you like to move permanently to another country, or would you prefer to continue living in this country?" Those who say yes are then asked which country they would choose.1 The 2025 results rest on interviews with about 144,000 adults aged 15 and older, by telephone, face to face or on the web, in roughly 140 countries and areas. Gallup gives a margin of error of less than one percentage point for the full sample.1
Two numbers are easy to mix up. The first is the share of all adults who want to leave their country for good: 15 percent in 2025, one point lower than the record 16 percent held from 2021 to 20241, and the lowest since 2018. The second is the share of those would-be migrants who pick the US: also 15 percent. Gallup estimates that about 900 million people worldwide would like to move, including about 134 million who would prefer the US.1 The US is still the most-named destination; Canada comes second at 9 percent.1
How far has the US share fallen since 2007?
The first global reading came from 2007 to 2009, when 24 percent of would-be migrants named the US, more than 165 million adults2.2 The share stayed near 20 percent through 2016 and has been at or below 18 percent every year since 2017.1 In the 2021 survey it was 18 percent, then about 160 million adults.3
| Period | US share of would-be migrants |
|---|---|
| 2007 to 2009 | 24% |
| Through 2016 | Near 20% |
| Since 2017 | 18% or lower |
| 2025 | 15% |
The count has fallen too, not only the share. Comparing Gallup's own estimates, about 165 million people named the US in 2007 to 2009, against about 134 million in 2025, even though the pool of would-be migrants is larger (about 700 million then, about 900 million now). So the fall is not just an effect of more people wanting to leave home.21
Where did the fall in the desire to move to the US come from?
Latin America and the Caribbean account for much of it. Gallup reports that the share of would-be migrants there who prefer the US fell from 33 percent in 2024 to 28 percent in 2025, and that seven of the 16 countries where the US share fell by at least 10 points are in that region. Mexico fell to 21 percent, matching its 2017 and 2018 lows, and Honduras fell from 71 percent to 36 percent, the largest drop in any country in 2025.1
Elsewhere the US was never the leader. Among would-be migrants in the Middle East and North Africa, Germany was named by 13 percent, Saudi Arabia by 12 percent and the US by 9 percent; in the European Union, Spain was at 11 percent, Switzerland at 8 percent and the US at 6 percent.1 Compared with 2007 to 2009, Canada's share rose from 7 percent to 9 percent and the UK's fell from 7 percent to 4 percent.1 Global desire to migrate also fell in 2025, so two things moved at once: fewer people want to leave home, and a smaller slice of them choose the US.
Does wanting to move mean people actually move?
Not directly, and Gallup says so itself. Plans to move are "much lower" than the wish, and not everyone who wants to move can or will.3 Its Potential Net Migration Index, which subtracts the share who would leave from the share who would come, is described as showing where interest exists, not as a forecast. On that index the US scored +37 percent in 2023 to 2025, down nine points4 from a decade earlier, which means more adults abroad say they would like to come than Americans say they would like to leave; Canada scored +225 percent.4
The wish to leave is also rising inside the US. Gallup found in 2025 that roughly 20 percent of Americans would like to move abroad permanently, and that 40 percent of women aged 15 to 44 say so, up from 10 percent in 2014. Gallup describes these findings as "aspirations rather than intentions", from a phone survey of 1,000 US adults with a margin of error of 4.4 points.5 We include it because it shows the same pattern from the other side: a stated wish moves faster and more cheaply than a removal van.
What do net international migration figures show?
The best official count is the Census Bureau's estimate of net international migration, which is arrivals minus departures. In the year to 30 June 2025 it was 1.3 million, down from 2.7 million the year before, a fall of 53.8 percent6. The Bureau projects about 321,000 for the year to July 2026 if current trends continue, and says the population grew 0.5 percent to 341.8 million, against 1.0 percent a year earlier.67
The Bureau attributes the fall to both fewer arrivals and more departures. It also warns that the departures estimate leans partly on Mexican survey data, that the 2025 year spans two very different periods of immigration policy, and that its 2026 figure rests on an assumption it calls challenging.7 Gallup notes that its survey period coincides with a sharp slowdown in migration into the US, but a poll of stated wishes cannot show which caused which, and the Census figures cover a different thing: people who moved, not people who said they would like to.
What is the strongest case against reading it as a new low?
A fair counterargument runs like this. The US remains the single most-named destination, with about 134 million adults naming it, and Gallup's own index still shows more people wishing to enter than to leave. A drop from 24 to 15 percent in a wide global sample may also reflect new options (Canada rose), wording and survey practicalities that Gallup says can add error, and a mood that could reverse. Gallup, for its part, reads the fall among US women as a broader shift in outlook rather than a short-term political effect, which is a judgement, not a measurement.15 Both readings fit the data in hand; the poll alone cannot separate them.
Why might this matter for pay and prices?
This section is our own reasoning, not a finding from the sources. Migrants add workers as well as spending, and Gallup notes that migration can help offset ageing and shrinking workforces in some countries.4 Whether fewer arrivals raise or lower wages and prices depends on who is arriving and on the state of the economy, which is why economists disagree. For the mechanisms, see our guides to why wages rise (https://therealigned.com/story/why-wages-rise), what causes inflation (https://therealigned.com/story/what-causes-inflation) and, for a historic case of scarce labour, the Black Death and wages (https://therealigned.com/story/black-death-and-wages). Nothing here is a forecast or advice.
What is not known
The Gallup pages we read do not say why individual respondents changed their answers, and they do not follow the same people over time. We do not know how much of the fall will persist, how many of the 134 million would act on the wish, or how the Census estimates will be revised as methods improve; the Bureau itself advises comparing years only within the same set of estimates.6 What the evidence supports is narrower: in 2025 a record-low share of the world's would-be migrants named the US, and, separately, recorded net migration into the US fell sharply.
Key takeaways
- Gallup's 2025 poll: 15% of would-be migrants name the US as their preferred destination, the lowest in nearly two decades, down from 24% in 2007 to 2009.
- The US is still the most-named destination, and about 134 million adults name it.
- A wish is not a plan: Gallup says plans are much lower than desire and the poll does not forecast who will move.
- Census figures show recorded net migration halved to 1.3 million in the year to June 2025, but a poll and a head count measure different things.
Sources
- 1Desire to Move Permanently to U.S. at New Low (opens the source in a new tab) · Gallup, 2026 · Survey · https://news.gallup.com/poll/708614/desire-migrate-drops-new-low.aspx
- 2700 Million Worldwide Desire to Migrate Permanently (opens the source in a new tab) · Gallup, 2009 · Survey · https://news.gallup.com/poll/124028/700-Million-Worldwide-Desire-Migrate-Permanently.aspx
- 3Nearly 900 Million Worldwide Wanted to Migrate in 2021 (opens the source in a new tab) · Gallup, 2023 · Survey · https://news.gallup.com/poll/468218/nearly-900-million-worldwide-wanted-migrate-2021.aspx
- 4How Migration Could Reshape Populations and Labor Forces (opens the source in a new tab) · Gallup, 2026 · Survey · https://news.gallup.com/poll/708680/migration-reshape-populations-labor-forces.aspx
- 5Record Numbers of Younger Women Want to Leave the U.S. (opens the source in a new tab) · Gallup, 2025 · Survey · https://news.gallup.com/poll/697382/record-numbers-younger-women-leave.aspx
- 6U.S. Population Growth Slows Due to Historic Decline in Net International Migration (opens the source in a new tab) · US Census Bureau, 2026 · Primary source · https://census.gov/newsroom/press-releases/2026/population-growth-slows.html
- 7New Population Estimates Show Historic Decline in Net International Migration (opens the source in a new tab) · US Census Bureau, 2026 · Primary source · https://census.gov/newsroom/blogs/random-samplings/2026/01/historic-decline-in-net-international-migration.html