The Great Inflation was the long stretch from the mid-1960s to the early 1980s when inflation was persistently high in the United States and the United Kingdom. Three things combined: policy that put full employment ahead of price stability, supply shocks such as the 1973 oil (https://therealigned.com/story/1973-oil-shock) embargo, and a public that came to expect more inflation. The episode ended only when central banks (https://therealigned.com/story/what-a-central-bank-does) and governments accepted a painful recession to break the expectations.
How bad was the 1970s inflation?
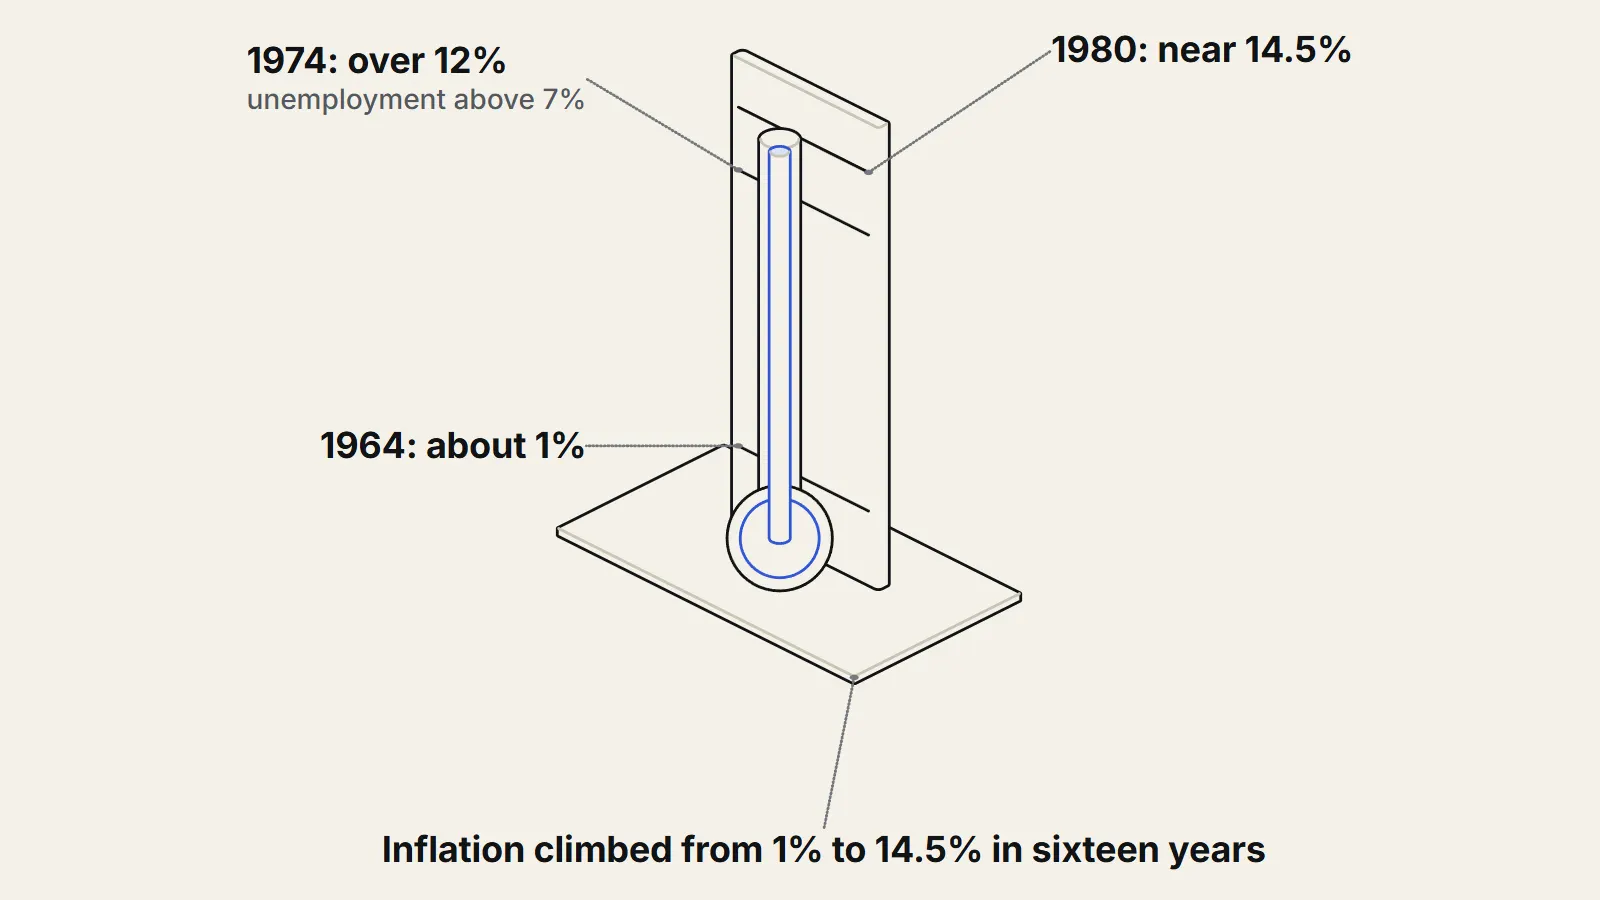
In the US, according to the Federal Reserve's own history, inflation was a little over 1 percent a year in 1964, with unemployment around 5 percent. By 1974 inflation was over 12 percent1 and unemployment above 7 percent, and in the summer of 1980 inflation was near 14.5 percent.1 The rise in 1974 came with weak output, which is why the decade is remembered for stagflation (https://therealigned.com/story/stagflation-explained): high inflation and high unemployment together.
In the UK the numbers were higher. A 2025 paper by Michael Bordo, Oliver Bush and Ryland Thomas notes that inflation reached a peak of around 25% in the summer of 19752 and was generally above that of other advanced economies throughout the decade. Unlike other double-digit episodes in the past century, it was not brought down quickly and proved extremely costly to eradicate.2
What caused the Great Inflation in the US?
The first cause was a policy bet. Policymakers followed the 1946 Employment Act's goal of full employment and assumed there was a stable trade-off between unemployment and inflation, the so-called Phillips curve. Economists Edmund Phelps and Milton Friedman warned that the trade-off would not hold once people came to expect inflation.1 Chair Arthur Burns, who led the Fed from 1970 to 1978, argued that full employment was the first priority, at a time when many felt that fighting inflation directly would cost too many jobs.1
The second was a loss of the old monetary anchor. The link between the dollar and gold broke down, and in summer 1971 President Nixon ended conversion of dollars into gold for foreign central banks.1 Nixon's wage and price controls, introduced in phases between 1971 and 1974, slowed price rises only temporarily and worsened shortages, and Gerald Ford's voluntary Whip Inflation Now campaign of 1974 failed.1 A Dallas Fed article adds that the controls, set in 1971, made the Fed feel free to stimulate the economy, and that the Fed overestimated how much output the economy could produce.3
The third was the oil price shock. The Arab oil embargo of 1973 and 1974 quadrupled crude oil prices, and the 1979 Iranian revolution tripled them again.1 But the oil shocks hit an economy where inflation was already above 7 percent before the October 1973 embargo.3
- 1964US inflation a little over 1 percent a year; unemployment about 5 percent.Source 1 (opens the source in a new tab)
- Summer 1971Nixon halts dollar-to-gold conversion for foreign central banks.Source 1 (opens the source in a new tab)
- 1973 to 1974Arab oil embargo quadruples crude oil prices.Source 1 (opens the source in a new tab)
- Summer 1975UK inflation peaks at around 25 percent.Source 2 (opens the source in a new tab)
- August 1979Paul Volcker becomes Fed chairman with US inflation above 11 percent.Source 1 (opens the source in a new tab)
- July 1981 to November 1982Deep US recession; unemployment peaks near 11 percent.Source 1 (opens the source in a new tab)
How did expectations become entrenched?
When inflation stays high for years, people stop treating it as a surprise. By the late 1970s the public expected an inflationary bias in policy, and expectations had become entrenched, according to the Fed history, which also notes that the warnings of Phelps and Friedman proved right as the unemployment-inflation trade-off worsened.1 Survey measures in the Dallas Fed article show short-run expected inflation rising from 2.1 percent in 1966 to 4.6 percent in 1971.3 Once workers ask for pay rises that assume future inflation and firms price the same way, the inflation keeps itself going, and a central bank that cuts it must first overcome that belief.
What went wrong in the UK?
The UK story overlaps with the US one but has its own twists. Inflation peaked at around 10 percent in 1971, fell back, then rose again after sterling was floated in June 1972, reaching its peak in 1975 after the first oil shock. It fell until mid-1976, peaked again in 1977 after a large fall in sterling, and surged again in 1979 and 1980 after the Winter of Discontent and the second oil shock.2 The authors say import prices combined with wage inflation of 35 percent explain the 1975 peak, and that firms absorbed much of the cost rises in part because of price controls.2
The authors' bigger claim is about fiscal policy. They argue it was at the heart of many of the UK's problems, because instead of stabilising the public finances it was used to hold down unemployment, support growth, offset losses from the terms of trade and strike deals with unions.2
How did the Great Inflation end?
In the US the turning point was October 6, 1979. Paul Volcker, who had become Fed chairman that August, announced that the Fed would focus on managing the volume of bank reserves instead of the daily federal funds rate.4 Interest rates soared, with the federal funds rate reaching a record 20 percent in late 19804.4 The price was two recessions, one in 1980 and a deeper one from July 1981 to November 1982. Unemployment peaked at 10.8 percent in late 1982, and by the end of the recession inflation was back under 5 percent.41
In the UK the 1980 Medium-term Financial Strategy made money-supply targets the centrepiece of policy, but the Bordo, Bush and Thomas paper says the link between money and spending broke down in the early 1980s, and that UK inflation was brought under control as much by changes in the fiscal regime as by the post-1979 changes in monetary policy.2
What is still disputed?
The strongest counterargument to the usual story concerns oil. The Dallas Fed article argues that oil was a symptom of inflation rather than its root cause: real oil prices fell through the 1960s and early 1970s, a 1972 to 1973 global boom driven by earlier monetary expansion raised demand for commodities, and geopolitical disruptions on their own predict at most a 25 percent real price rise in 1973 and 1974 against the observed quadrupling.3 Burns, for his part, did not see monetary policy as the main driver, pointing instead to private monopoly power, external shocks and weak fiscal discipline.3
Economists have long framed the debate as bad luck against bad policy. The UK paper concludes that unusually large commodity and supply shocks, and failures in both monetary and prices-and-incomes policies, can explain some of the major fluctuations, but not the persistence of the UK inflation.2
What is not known?
How much each factor contributed is not settled, and estimates depend on the model. Real-time mistakes also matter: the Fed history notes that economist Athanasios Orphanides found that real-time estimates overstated potential output and understated the unemployment rate consistent with full employment, so policymakers believed they had more room than they did.1 It is not known how the 1970s would have gone with different data or different leaders. This article explains history and mechanisms and is not advice about money. Read the Federal Reserve History essay (https://www.federalreservehistory.org/essays/great-inflation) and the NBER paper on the UK (https://www.nber.org/papers/w34063) for the full accounts.
Key takeaways
- US inflation rose from about 1 percent in 1964 to near 15 percent in 1980; UK inflation peaked near 25 percent in 1975.
- Policy put full employment first, on the belief that unemployment and inflation could be traded off.
- Oil shocks, the end of the gold link and failed price controls added to the pressure.
- Expectations became entrenched, so ending the inflation required high interest rates and deep recessions.
- Economists still argue over whether oil was a cause or a symptom, and how much was bad luck rather than bad policy.
Sources
- 1The Great Inflation (opens the source in a new tab) · Federal Reserve History (Federal Reserve Board), 2013 · Primary source · https://www.federalreservehistory.org/essays/great-inflation
- 2Muddling Through or Tunnelling Through? UK Monetary and Fiscal Exceptionalism and the Great Inflation (opens the source in a new tab) · National Bureau of Economic Research (Working Paper 34063), 2025 · Paper · https://www.nber.org/papers/w34063
- 3Lessons from the destabilization of inflation in the 1970s (opens the source in a new tab) · Federal Reserve Bank of Dallas, 2026 · Essay · https://www.dallasfed.org/research/economics/2026/0217
- 4Anti-Inflation Measures (1979-1982) (opens the source in a new tab) · Federal Reserve History (Federal Reserve Board), 2013 · Primary source · https://www.federalreservehistory.org/essays/anti-inflation-measures