Summary
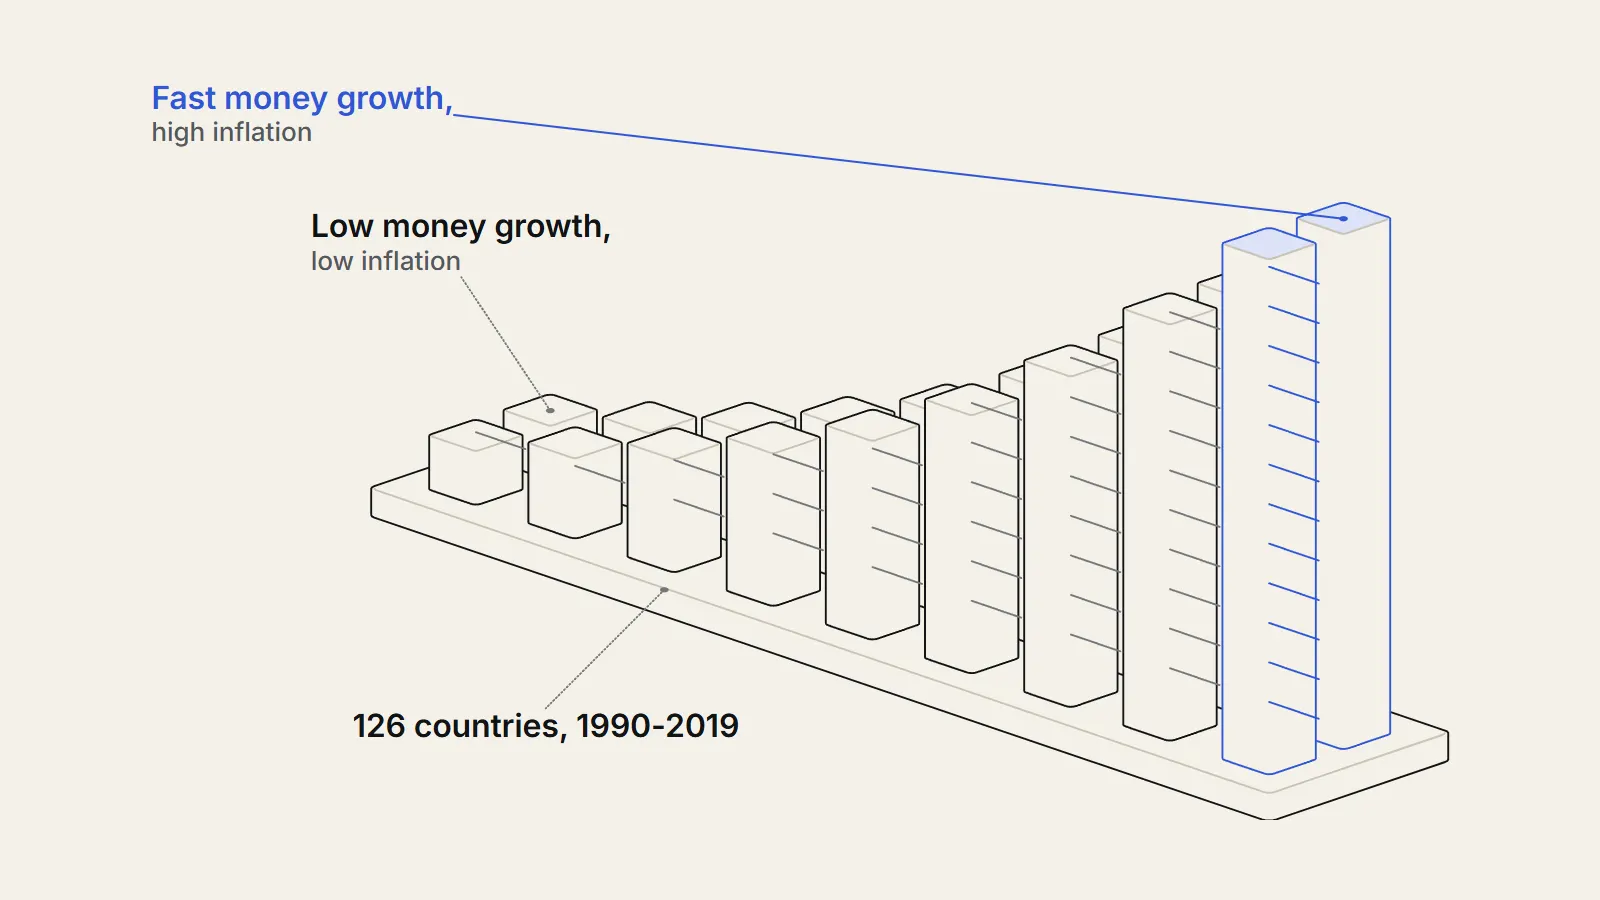
Does money supply growth and inflation move together across countries? We took World Bank data for 126 countries, averaged each over 1990 to 2019, and compared broad money growth less real GDP growth with consumer price inflation. The rank correlation was 0.921, and the slope was 1.20. Without the 14 countries averaging 30 percent inflation or more the slope fell to 0.712, and over single decades the link among low-inflation countries was weaker, 0.50 to 0.63.
The question
Is money supply growth tied to inflation across countries?
One old idea in economics, the quantity theory of money, says that if a country creates money much faster than its economy grows, prices should rise at about the gap. A country in which the stock of money grows 15 percent a year while output grows 5 percent has 10 points of extra money chasing the same goods.
Our question: across countries, do those with faster broad money growth have higher inflation? We set the test before looking. We would count a strong relationship as a rank correlation above 0.7 together with a slope near one, and a weak one as below 0.4. We also asked whether the link survives when we remove the countries with the most extreme inflation, and whether it is stable across decades.
Our hypothesis, written before we opened the data, was that the link is strong in the long run, weaker in calm periods, and not proof of cause.
What have other studies found?
The research has a long history. Robert Lucas compared moving averages of US quarterly data for 1953 to 1977 and found the pattern the theory predicts: a given change in money growth was matched by an equal change in inflation.3 In 1995 George McCandless and Warren Weber of the Federal Reserve Bank of Minneapolis looked across 110 countries over 30 years and three definitions of money.
Growth rates of the money supply and the general price level are highly correlated.
— McCandless and Weber, Federal Reserve Bank of Minneapolis Quarterly Review, 1995
They also found that money growth and real output growth were not correlated, apart from the OECD subsample.4 Paul De Grauwe and Magdalena Polan revisited the question with about 160 countries over 30 years. They found a strong positive long-run relation but not a proportional one, and argued that it came almost wholly from the high- and hyperinflation (https://therealigned.com/story/hyperinflation-how-a-currency-collapses) countries, with a weak relation among low-inflation countries.5
The relation is not proportional, however.
— De Grauwe and Polan, Scandinavian Journal of Economics, 2005, abstract
Luca Benati of the European Central Bank studied two centuries of data. He found that the long-run coherence between money growth and inflation has been close to one, so long-run money growth explains most of the long-run variation in inflation, but that the one-for-one proportionality appeared only with the First World War and the Great Inflation, and fell below one after the early-1980s disinflation.6
The fraction of inflation's long-run variation explained by long-run money growth has been very high and relatively stable.
— Luca Benati, European Central Bank Working Paper 1027, 2009
Finally, for the most recent episode, Ben Bernanke and Olivier Blanchard concluded that most of the 2021 to 2022 US inflation came from direct price shocks, such as commodities and shortages, and that fiscal policy worked mainly through consumer demand.7 That is a different story from money growth, and we return to it below.
Our contribution is small. We rebuild the cross-country comparison from raw public data, add the years since 2019, split by decade and income group, and add a look at the US monthly record.
Data
Which country data did we use?
We downloaded three annual indicators for every country from the World Bank World Development Indicators (https://datacatalog.worldbank.org/search/dataset/0037712/World-Development-Indicators): broad money growth, consumer price inflation and real GDP growth, for 1970 to 2023. We also downloaded the World Bank country list, which labels aggregates such as regions and income groups, and dropped those, leaving national economies.1011
A country entered a period only if it had at least 80 percent of years with all three values. That gave 126 countries for 1990 to 2019, 114 for the 1990s, 145 for the 2000s, 146 for the 2010s and 121 for 2020 to 2023. The sets differ, because money growth data are missing for many countries and years; for example, Germany has no broad money growth values in this dataset.
The three indicators carry the World Bank titles Broad money growth (annual %), Inflation, consumer prices (annual %) and GDP growth (annual %). Inflation is the annual percent change in consumer prices; GDP growth is the annual percent growth of real output. Broad money is the wider measure of money that includes bank deposits, which is why we prefer it to currency alone. The three series come from the same World Bank database, which makes the country labels consistent, although national statistics offices produce the underlying numbers.
Why add a US time series?
A cross-section of country averages tells us about differences between countries over decades. It cannot tell us about timing within a country. So we added the monthly US M2 money stock and the consumer price index from FRED, to see how money growth and inflation line up in time.912
Method
How did we measure the link?
Step one: for each country and period we averaged the annual values of money growth, inflation and GDP growth. Step two: we subtracted GDP growth from money growth to get excess money growth. Step three: we computed the Pearson and Spearman correlations between that excess and inflation across countries, and the slope of a straight line through the points. Spearman uses ranks, so extreme values count less.
Step four: we repeated this without countries whose average inflation reached 30 percent, and again for countries under 10 percent. Step five: we grouped countries into thirds by excess money growth and compared the median inflation of each third, which needs no formula. Step six: we repeated everything for income groups and for each decade.
How did we check the US timing?
For the US we computed year-over-year growth of M2 and of the CPI for each month, then correlated money growth in one month with inflation k months later, for k of 0, 6, 12, 18, 24 and 36. We did this for 1960 to 1989, 1990 to 2019 and 2020 to 2026. The overlapping twelve-month windows make neighbouring months almost the same, so these correlations are descriptive, not tests.
Can the calculation be followed for one country?
Yes. Take the United States for 2010 to 2019. The World Bank series for annual broad money growth runs minus 2.8, 6.7, 4.9, 4.5, 5.2, 3.1, 3.8, 4.8, 4.0 and 8.4 percent. Real GDP growth runs 2.7, 1.6, 2.3, 2.1, 2.5, 2.9, 1.8, 2.5, 3.0 and 2.6. Inflation runs 1.6, 3.2, 2.1, 1.5, 1.6, 0.1, 1.3, 2.1, 2.4 and 1.8.
The averages are money growth 4.27, GDP growth 2.40 and inflation 1.77. Excess money growth is 4.27 minus 2.40, or 1.88 points. That country becomes one dot in the scatter chart, at 1.88 on the horizontal axis and 1.77 on the vertical axis. We repeat this for every country and compute the correlation over the dots.
How did we put an interval on the numbers?
We resampled the list of countries 2,000 times with replacement, recomputed each statistic each time, and took the 2.5th and 97.5th percentiles. The random seed is fixed in the script so the result can be reproduced. We also ran a Theil-Sen slope, which is the median slope over all pairs of countries, because it does not depend on a few extreme points.
- Country list: aggregates removed with the World Bank region field.
- Coverage: at least 80 percent of years with all three values, tested at 50 and 100 percent.
- Outlier rules: drop average inflation of 30 percent or more, 10 percent or more, 100 percent or more, or the top five.
- Statistic: Pearson, Spearman, ordinary and Theil-Sen slopes.
- Uncertainty: 2,000 bootstrap resamples with a fixed seed.
A second script with a different code path and a different filter for aggregates gave the same 126 countries and the same Pearson correlations of 0.94 and 0.95.
Findings
How strong is the money supply growth and inflation link over 30 years?
Over 1990 to 2019, with 126 countries, average broad money growth and average inflation had a Pearson correlation of 0.94 and a Spearman correlation of 0.891.12 Using excess money growth, Pearson rose to 0.95, Spearman to 0.92, and the slope was 1.20: each extra point of excess money growth went with about 1.2 points of inflation.
The strongest cases are extreme. Brazil, Peru, Angola, Ukraine and Armenia averaged between 141 and 285 percent inflation. Those few points anchor the line. The thirds comparison shows the pattern without a formula: the lowest third by excess money growth had median excess growth of 4.7 points and median inflation of 2.6 percent; the middle third 9.1 and 6.1; the highest third 21.3 and 18.21.1
Does the link survive without hyperinflations?
It survives but shrinks. Without the 14 countries averaging 30 percent or more, the Spearman correlation stayed at 0.89 but the slope fell from 1.20 to 0.71.2 That agrees with De Grauwe and Polan that the relation is not proportional once the extreme cases go.5 Our result differs from their reading in one respect: even among the 88 countries under 10 percent inflation, the 30-year Spearman correlation was 0.84.
| Period | Countries | Spearman | Pearson | Slope | Spearman excl. 30%+ | Slope excl. 30%+ |
|---|---|---|---|---|---|---|
| 1990-2019 | 126 | 0.92 | 0.95 | 1.20 | 0.89 (n=112) | 0.71 |
| 1990-1999 | 114 | 0.84 | 0.97 | 1.18 | 0.77 (n=98) | 0.70 |
| 2000-2009 | 145 | 0.74 | 0.87 | 0.70 | 0.73 (n=142) | 0.46 |
| 2010-2019 | 146 | 0.69 | 0.85 | 0.65 | 0.69 (n=145) | 0.61 |
| 2020-2023 | 121 | 0.72 | 0.90 | 0.75 | 0.70 (n=118) | 0.53 |
Is the link weaker over single decades?
Yes. By decade, the Spearman correlation between excess money growth and inflation was 0.84 in the 1990s, 0.74 in the 2000s, 0.69 in the 2010s and 0.72 for 2020 to 2023. Among countries under 10 percent inflation it was lower: 0.50 in the 1990s, 0.59 in the 2000s, 0.63 in the 2010s and 0.55 in 2020 to 20231, with slopes of 0.25, 0.26, 0.40 and 0.19.1
Why is a 30-year correlation of 0.84 so much higher than the decade ones? Averaging over 30 years cancels short-term noise, such as one-off swings in money demand. This is the point of the long-run view in Lucas and in Benati.36 The cost is that the average hides what happens year by year.
| Period | Countries under 10% inflation | Spearman | Pearson | Slope | R-squared |
|---|---|---|---|---|---|
| 1990-2019 | 88 | 0.84 | 0.77 | 0.46 | 0.59 |
| 1990-1999 | 70 | 0.50 | 0.51 | 0.25 | 0.26 |
| 2000-2009 | 114 | 0.59 | 0.59 | 0.26 | 0.34 |
| 2010-2019 | 133 | 0.63 | 0.63 | 0.40 | 0.40 |
| 2020-2023 | 98 | 0.55 | 0.44 | 0.19 | 0.19 |
Does the link differ by income group?
Among high-income countries (34 with enough data), the Spearman correlation for 1990 to 2019 was 0.87 and the slope 1.38; for upper-middle-income countries (48) 0.94 and 1.27; for lower-middle-income (31) 0.83 and 0.99; and for low-income (13) 0.89 and 0.77. Median inflation was 2.9 percent in the high-income group and between 6.4 and 7.3 percent in the others.
The slopes fall from rich to poor, though the low-income group is small and the slope in each group is pulled by a few high-inflation members. We do not read the pattern as a finding. It tells us that the link is present in every income group.
| Income group | Countries | Median inflation (%) | Spearman | Slope |
|---|---|---|---|---|
| High income | 34 | 2.9 | 0.87 | 1.38 |
| Upper middle income | 48 | 7.1 | 0.94 | 1.27 |
| Lower middle income | 31 | 7.3 | 0.83 | 0.99 |
| Low income | 13 | 6.4 | 0.89 | 0.77 |
How uncertain are these numbers?
Every correlation here comes from a sample of countries, and a different set of countries would give different numbers. To measure that, we drew 2,000 random resamples of countries, with replacement, and recomputed each statistic. The middle 95 percent of the resampled values gives a rough interval. It captures sampling variation but not measurement error or missing data.
For 1990 to 2019 with all 126 countries, the Spearman correlation of 0.92 had an interval of 0.88 to 0.95 and the slope of 1.20 an interval of 1.07 to 1.70. The slope interval is wide and lopsided because a few extreme points carry a lot of weight. Among the 112 countries under 30 percent inflation the slope of 0.71 had an interval of 0.54 to 0.87, which excludes one. So the loss of proportionality when we remove hyperinflations is larger than sampling noise.
Among the 88 countries under 10 percent inflation, the 30-year Spearman correlation was 0.84 with an interval of 0.76 to 0.89. In single decades it was lower and less certain: 0.63 (0.50 to 0.74) for the 2010s and 0.50 (0.26 to 0.69) for the 1990s.
| Group | Countries | Spearman (95% interval) | Slope (95% interval) |
|---|---|---|---|
| 1990-2019, all | 126 | 0.92 (0.88 to 0.95) | 1.20 (1.07 to 1.70) |
| 1990-2019, under 30% | 112 | 0.89 (0.84 to 0.92) | 0.71 (0.54 to 0.87) |
| 1990-2019, under 10% | 88 | 0.84 (0.76 to 0.89) | 0.46 (0.36 to 0.61) |
| 2010-2019, under 10% | 133 | 0.63 (0.50 to 0.74) | 0.40 (0.32 to 0.51) |
| 1990-1999, under 10% | 70 | 0.50 (0.26 to 0.69) | 0.25 (0.14 to 0.38) |
Do robust methods and other rules change the answer?
We tried four alternatives. First, a Theil-Sen slope, the median of the slopes between every pair of countries, which is little moved by extreme points. For 1990 to 2019 it was 0.91 for all countries, 0.76 for those under 30 percent and 0.56 for those under 10 percent, against ordinary least squares slopes of 1.20, 0.71 and 0.46. So the two methods agree that the slope is below one in calm countries and that it is lower than the full-sample figure.
Second, we changed the coverage rule. Requiring only half of the years gave 151 countries and a Spearman correlation of 0.91; requiring all 30 years gave 89 countries and 0.92. The slope was more sensitive: 1.77 with the loosest rule, 1.20 at 80 percent and 1.14 with full coverage. The rank correlation does not depend on which countries have gaps.
Third, we dropped the five countries with the highest average inflation. The Spearman correlation stayed at 0.91 with 121 countries, and the slope rose to 1.38. Dropping every country at or above 100 percent left 119 countries with a Spearman correlation of 0.91 and a slope of 1.16. Fourth, we looked at regions. The result is below.
| Rule | Countries | Spearman | Slope |
|---|---|---|---|
| Baseline, at least 80% of years | 126 | 0.92 | 1.20 |
| At least 50% of years | 151 | 0.91 | 1.77 |
| All 30 years | 89 | 0.92 | 1.14 |
| Drop the five highest-inflation countries | 121 | 0.91 | 1.38 |
| Inflation under 100% only | 119 | 0.91 | 1.16 |
| Inflation under 30% only | 112 | 0.89 | 0.71 |
| Inflation under 10% only | 88 | 0.84 | 0.46 |
Does the link hold in every region?
Yes, in the regions with enough countries. For 1990 to 2019 the Spearman correlation was 0.96 in Europe and Central Asia (22 countries), 0.88 in the Middle East, North Africa, Afghanistan and Pakistan (13), 0.89 in Sub-Saharan Africa (34), 0.88 in Latin America and the Caribbean (28), and 0.91 in East Asia and the Pacific (22). South Asia had 6 countries and a correlation of 0.60; North America had one and is too small to use.
Median inflation varied from 3.9 percent in East Asia and the Pacific to 10.2 percent in Europe and Central Asia. Nine of the 22 countries in the latter region averaged 30 percent inflation or more, so its high correlation may owe something to them; we did not run the region-by-region exclusion.
Which countries sit off the line?
Among the 112 countries under 30 percent inflation, the fitted line was inflation = minus 0.07 plus 0.71 times excess money growth. Five had inflation well below the line: Guinea-Bissau (excess 37.5 points, inflation 14.0 percent), Cambodia (17.5, 4.5), Viet Nam (19.1, 6.2), Georgia (17.2, 6.9) and The Gambia (13.8, 5.9). Five had inflation above it: Ecuador (11.0, 19.8), Uruguay (20.9, 21.8), Zambia (25.1, 24.0), Honduras (8.2, 10.9) and Jamaica (14.5, 15.0).
One possible reason for the low cases is financial deepening. When people hold more of their wealth in bank deposits, broad money can grow faster than prices without causing inflation. We did not test this, and the data cannot.
Do the largest economies fit?
The table shows ten-year and four-year averages for selected countries. The United States had money growth of 4.3 percent a year, GDP growth of 2.4 and inflation of 1.8 in 2010 to 2019, then 8.8, 2.4 and 4.5 in 2020 to 2023. Japan had 2.8, 1.3 and 0.5, then 3.7, 0.3 and 1.4. The United Kingdom moved from 2.3, 2.0 and 2.1 to 6.4, 1.0 and 4.6.
At the other end, Türkiye went from 17.2, 5.9 and 9.8 to 54.3, 6.0 and 39.5, and Argentina in 2020 to 2023 had money growth of 91.0 percent and inflation of 74.1. China is the counterexample: money growth of 12.4 percent a year and GDP growth of 7.7 produced inflation of just 2.6 percent in 2010 to 2019, and 10.2, 4.9 and 1.4 in 2020 to 2023.
| Country | Period | Money growth (%) | GDP growth (%) | Inflation (%) |
|---|---|---|---|---|
| United States | 2010-2019 | 4.3 | 2.4 | 1.8 |
| United States | 2020-2023 | 8.8 | 2.4 | 4.5 |
| Japan | 2010-2019 | 2.8 | 1.3 | 0.5 |
| Japan | 2020-2023 | 3.7 | 0.3 | 1.4 |
| United Kingdom | 2010-2019 | 2.3 | 2.0 | 2.1 |
| United Kingdom | 2020-2023 | 6.4 | 1.0 | 4.6 |
| Brazil | 2010-2019 | 10.9 | 1.4 | 5.8 |
| Brazil | 2020-2023 | 14.2 | 1.9 | 6.3 |
| Türkiye | 2010-2019 | 17.2 | 5.9 | 9.8 |
| Türkiye | 2020-2023 | 54.3 | 6.0 | 39.5 |
| China | 2010-2019 | 12.4 | 7.7 | 2.6 |
| China | 2020-2023 | 10.2 | 4.9 | 1.4 |
What does the US monthly record say about timing?
The US data give a sharper test of timing. From 1960 to 1989, money growth showed little link with inflation in the same month (0.02), but the correlation with inflation 24 months later was 0.42 and 36 months later 0.51. From 1990 to 2019 it was negative at every lag we tried, between minus 0.13 and minus 0.28. Money growth and inflation simply moved apart in that period.
The 2020s are different. US M2 growth peaked at 26.8 percent in February 2021, and CPI inflation peaked at 9.0 percent in June 2022, 16 months later.912 M2 then fell, down 4.6 percent year over year in April 2023, and inflation dropped to 3.1 percent in June 2023. For 2020 to 2026 the correlation between M2 growth and inflation 18 months later was 0.93.
That fit is striking, but it rests on one episode in 62 overlapping months. The same method in 1990 to 2019 gave nothing. Bernanke and Blanchard attribute most of the 2021 to 2022 inflation to direct price shocks, such as commodities and shortages, not to money.7 Both can be true: a large rise in money may allow prices to rise, while supply shocks decide which prices and when.
- 1995McCandless and Weber report high correlation of money and price growth in 110 countriesSource 4 (opens the source in a new tab)
- 2005De Grauwe and Polan find the link not proportional and driven by high-inflation countriesSource 5 (opens the source in a new tab)
- 2019-12US M2 growth 6.7 percent a year, CPI inflation 2.3 percentSource 9 (opens the source in a new tab)
- 2021-02US M2 growth peaks at 26.8 percentSource 9 (opens the source in a new tab)
- 2022-06US CPI inflation peaks at 9.0 percentSource 12 (opens the source in a new tab)
- 2023-04US M2 growth falls to minus 4.6 percentSource 9 (opens the source in a new tab)
What do the inflation bands show?
Another way to see the link is to group countries by their average inflation. The 32 countries under 3 percent inflation had median excess money growth of 4.5 points. For the 32 between 3 and 6 percent it was 6.3; for the 24 between 6 and 10, 11.1; for the 24 between 10 and 30, 15.1; and for the 14 at 30 percent or more, 47.0, with median inflation of 105.1 percent.
| Average inflation 1990-2019 | Countries | Median excess money growth (points) | Median inflation (%) |
|---|---|---|---|
| Under 3% | 32 | 4.5 | 2.5 |
| 3 to 6% | 32 | 6.3 | 4.2 |
| 6 to 10% | 24 | 11.1 | 7.3 |
| 10 to 30% | 24 | 15.1 | 13.1 |
| 30% and over | 14 | 47.0 | 105.1 |
How do our results compare with earlier studies?
Direction first. McCandless and Weber found money growth and inflation highly correlated across 110 countries.4 So do we: the Pearson correlation of average money growth and inflation was 0.94 over 1990 to 2019. They used an earlier 30-year window and three separate money definitions, so the match is in direction, not in the exact numbers.
The disagreement is about proportionality and about what survives without the extreme cases. De Grauwe and Polan say the link is almost wholly due to high-inflation countries and is weak among low-inflation ones.5 Our results sit between the two readings. Without countries at or above 30 percent inflation, our 30-year rank correlation stayed at 0.89, and among the 88 countries under 10 percent it was 0.84, which is not weak. But their word fits our decade results better: among countries under 10 percent inflation the correlation fell to 0.50 to 0.63 in single decades, with slopes of only 0.19 to 0.40.
A likely reason for the difference is averaging. A long average smooths away year-to-year noise in money demand, so a 30-year window shows a strong link even in calm countries, and a 10-year window shows a weaker one. The earlier papers each used a single window, so they could not show this.
The time-series side is closer to Benati. He finds that the long-run coherence has been close to one for two centuries, while the proportionality fell below one after the early-1980s disinflation.6 Our US monthly data show something compatible: a positive link with a lag of two to three years in 1960 to 1989, no link or a negative one in 1990 to 2019, and a strong one in the 2020s. Different methods are in play, so we call it consistent, not confirmed.
Lucas used moving averages of US quarterly data for 1953 to 1977 to illustrate the theory.3 His period lies before the break that Benati describes and before the stretch in which our US correlation turns negative.
What do the findings add up to?
Against our two tests, the first part of the hypothesis is supported. Over 30 years, countries with faster excess money growth had much higher inflation: the rank correlation was 0.92, well above our 0.7 line, and it held in every region with enough countries, in every income group and under every country filter we tried.
The proportionality half is not supported. The slope of 1.20 depends on a handful of hyperinflations; without them it is 0.71, and the interval excludes one. Among calm countries the slope is 0.46 over 30 years and 0.19 to 0.40 in single decades. The second part of the hypothesis, a weaker link in calm periods, is supported: single-decade rank correlations among countries under 10 percent inflation were 0.50 to 0.63.
The US record adds a caution. The link between M2 growth and inflation was absent for 30 years and strong in the 2020s, in a single episode. A rule that works only in some decades is hard to use as a forecast, which is why we describe our findings and do not predict.
How do the objections hold up?
First: money growth does not cause inflation, it follows it. Central banks often supply more money when prices rise, so the correlation could run backwards. Our cross-section cannot separate the directions. The US timing results are consistent with money leading in the 1960 to 1989 and 2020 to 2026 periods, and silent in between.
Second: the relation is driven by a handful of hyperinflations. We checked. Dropping them lowers the slope from 1.20 to 0.71 and leaves the rank correlation at 0.89 for 30-year averages. It does not remove the link, but it removes proportionality.
Third: broad money is measured differently across countries. That is true and we cannot adjust for it. If measurement error is random, it would weaken the correlation, so the true link might be stronger. If it is systematic, it could produce spurious patterns.
Fourth: velocity, the speed at which money circulates, changes. If people hold more money for a given income, money can grow faster than prices. Benati proposes that systematic velocity shocks, together with infrequent inflationary outbursts, explain why the long-run proportionality has shifted.6 Our excess money growth measure does not adjust for velocity.
Limitations
What could mislead us?
Correlation is not cause. A government that runs large deficits may print money and cause inflation, but central banks also expand money after prices rise, and a currency crisis can raise both at once. Broad money is defined differently across countries and over time, and inflation statistics from some countries in crises are weak.
We averaged over decades, so short-run behaviour is invisible. Large money growth in some rich economies in the 2010s came with low inflation, which our averages cannot unpack. We did not control for changes in velocity, banking reforms, exchange-rate regimes, fiscal deficits, trade shocks or energy prices.
The conclusions about calm countries rest on smaller groups: 88 countries for the 30-year result and between 70 and 133 in the decade results. Country coverage changes between periods. Missing data are probably not random, so the countries we can see may differ from those we cannot. The 2020 to 2023 window has only four years, so a few large shocks decide each country average. The slope depends on the cut-off for outliers, which we set at 30 percent before the run and then reported alongside the full sample. The US time series correlations use overlapping windows and a single country.
Why did excess money growth have so little relation to inflation across rich countries in the 2010s, and so much in the 2020s?
Conflicts
Conflicts of interest
The Realigned has no commercial relationship with the World Bank, the International Monetary Fund, the Federal Reserve Bank of St. Louis, or any central bank or author we cite. The analysis was done by The Realigned. The question and the 30 percent cut-off were fixed before we opened the data. The splits by income group, the 10 percent subgroup and the US lag analysis were added afterwards and are labelled.
Sources
- 1Broad money growth (annual %) (opens the source in a new tab) · World Bank, World Development Indicators, 2026 · Dataset · https://api.worldbank.org/v2/country/all/indicator/FM.LBL.BMNY.ZG?format=json&per_page=20000&date=1970%3A2023
- 2Inflation, consumer prices (annual %) (opens the source in a new tab) · World Bank, World Development Indicators, 2026 · Dataset · https://api.worldbank.org/v2/country/all/indicator/FP.CPI.TOTL.ZG?format=json&per_page=20000&date=1970%3A2023
- 3Two Illustrations of the Quantity Theory of Money (opens the source in a new tab) · American Economic Review 70(5), 1980 · Paper · https://www.bu.edu/econ/files/2011/01/Lucas2illustrations1.pdf
- 4Some Monetary Facts (opens the source in a new tab) · Federal Reserve Bank of Minneapolis Quarterly Review 19(3), 1995 · Paper · https://www.minneapolisfed.org/research/quarterly-review/some-monetary-facts
- 5Is Inflation Always and Everywhere a Monetary Phenomenon? (opens the source in a new tab) · Scandinavian Journal of Economics 107(2), 2005 · Paper · http://eprints.lse.ac.uk/46584/
- 6Long Run Evidence on Money Growth and Inflation (opens the source in a new tab) · European Central Bank Working Paper 1027, 2009 · Paper · https://www.ecb.europa.eu/pub/pdf/scpwps/ecbwp1027.pdf
- 7What Caused the U.S. Pandemic-Era Inflation? (opens the source in a new tab) · Hutchins Center, Brookings / PIIE, 2023 · Paper · https://www.brookings.edu/articles/what-caused-the-u-s-pandemic-era-inflation
- 8GDP growth (annual %) (opens the source in a new tab) · World Bank, World Development Indicators, 2026 · Dataset · https://api.worldbank.org/v2/country/all/indicator/NY.GDP.MKTP.KD.ZG?format=json&per_page=20000&date=1970%3A2023
- 9M2 (M2SL) (opens the source in a new tab) · FRED, Federal Reserve Bank of St. Louis, 2026 · Dataset · https://fred.stlouisfed.org/series/M2SL
- 10World Development Indicators (opens the source in a new tab) · World Bank Data Catalog, 2026 · Primary source · https://datacatalog.worldbank.org/search/dataset/0037712/World-Development-Indicators
- 11World Bank country list with region and income group (opens the source in a new tab) · World Bank API, 2026 · Dataset · https://api.worldbank.org/v2/country?format=json&per_page=400
- 12Consumer Price Index for All Urban Consumers: All Items in U.S. City Average (opens the source in a new tab) · FRED, Federal Reserve Bank of St. Louis, 2026 · Dataset · https://fred.stlouisfed.org/series/CPIAUCSL
Plain-language version
The short version
Countries that create money much faster than their economies grow tend to have higher inflation, and over thirty years that pattern is strong. A handful of countries with extreme price rises account for a lot of it. In calmer countries and in single decades the link is looser, so money growth alone does not predict next year's inflation. In the United States, the link was weak for thirty years and strong around 2021 and 2022. Our data cannot say which one causes the other.
Key takeaways
- Across 126 countries, 1990 to 2019, money growth less GDP growth and inflation had a rank correlation of 0.92.
- Countries with the fastest money growth had median inflation of 18.2 percent, those with the slowest 2.6 percent.
- Without hyperinflation cases, the slope fell from 1.20 to 0.71, and within calm countries single-decade correlations were 0.50 to 0.63.
- US money growth peaked in February 2021 and inflation in June 2022, but the link was absent in 1990 to 2019.