The 1973 oil shock was a sudden, large rise in the price of crude oil that followed an Arab embargo on the United States in October 1973. It started with a political decision by oil exporters, but the long gasoline queues Americans remember had a second cause closer to home: federal price controls that kept pump prices below what the market would have set. Together, the supply cut and the controls turned a hard problem into a patchwork of shortages. This piece sets out what happened, why the lines formed where they did, what economists dispute, and what changed afterwards.
What caused the 1973 oil shock?
The trigger was the Yom Kippur War between Israel and its Arab neighbours. On October 19, 1973, the Organization of Arab Petroleum Exporting Countries (OAPEC) put an embargo on oil shipments to the United States, after President Nixon asked Congress for $2.2 billion in emergency aid for Israel. The group also began production cuts. The embargo was lifted in March 1974.1
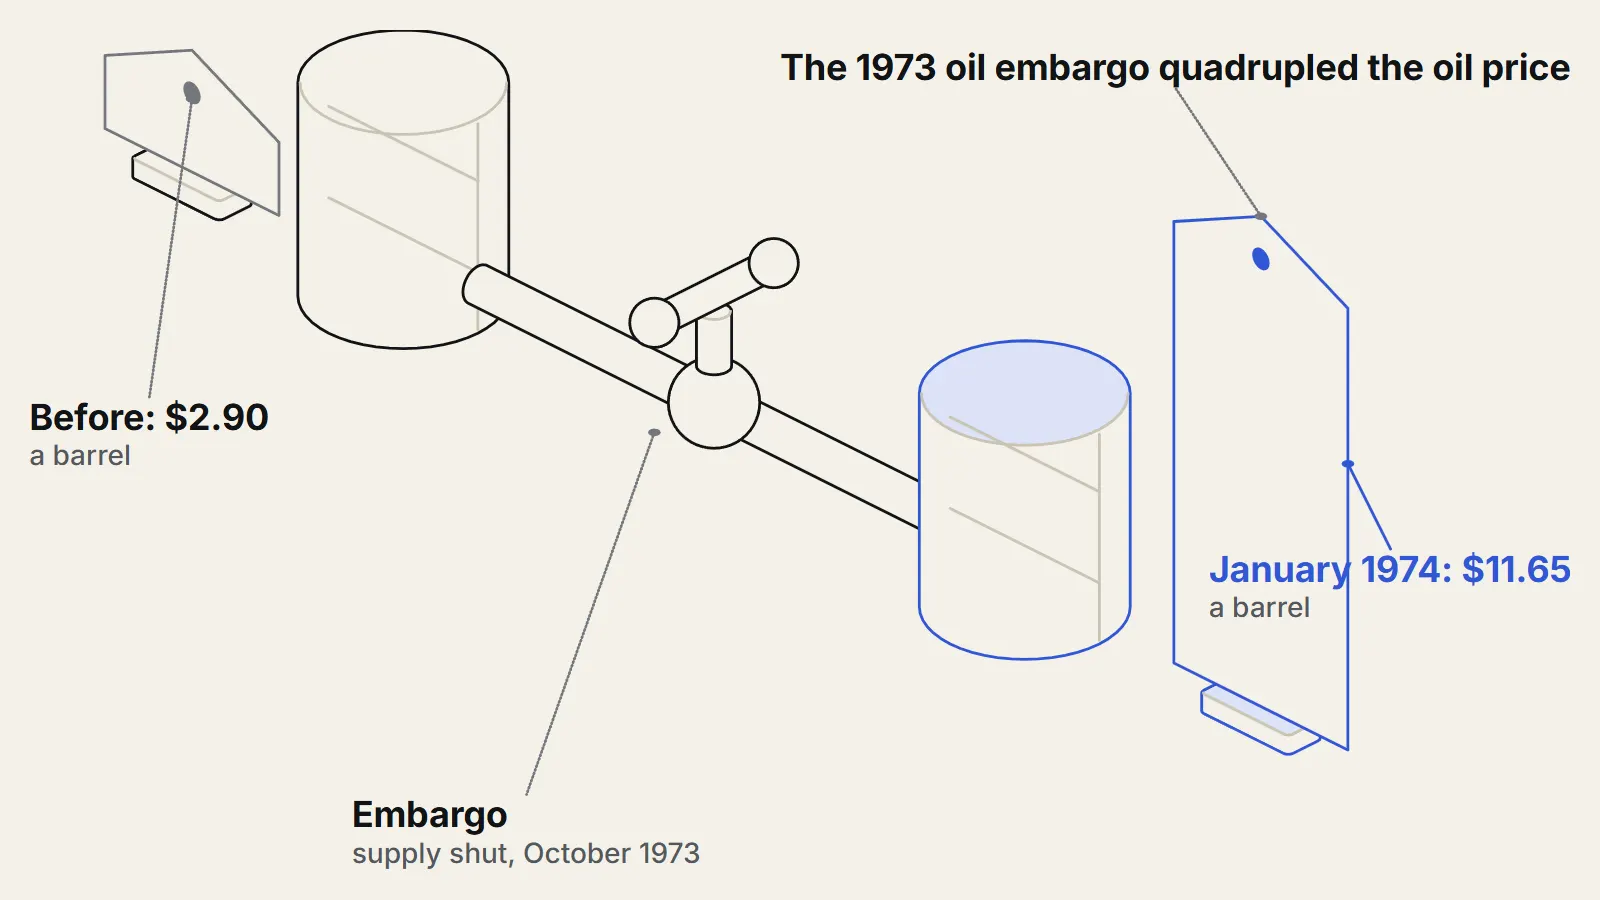
The price effect was far larger than the volume effect. The price of oil nearly quadrupled, from $2.90 a barrel before the embargo to $11.65 a barrel in January 1974.1 A cut in supply can move prices this much because, in the short run, neither drivers nor factories can quickly change how much oil they use.
The embargo landed on an economy that was already strained. The Federal Reserve's history notes that by mid-1973 wholesale prices for industrial goods were rising at more than 10 percent a year and that the U.S. oil industry had little spare capacity. The dollar had also been devalued in 1971 and 1973, and because oil was priced in dollars, that cut exporters' real revenue.1
How did price controls turn a supply cut into queues?
A price does three jobs when oil is scarce: it makes some buyers give up purchases, it pulls fuel to where it is most wanted, and it signals producers to find more. Holding the price down switches those jobs off. Demand stays high, and nothing steers limited fuel to the places that need it most.
Oil in the United States was not free of controls. President Nixon had put wages and prices under a three-phase control programme between 1971 and 1974, and the Federal Reserve's history says these controls slowed price rises only for a time while making shortages worse, especially in food and energy.2 After the embargo began, Congress passed the Emergency Petroleum Allocation Act of 1973. It gave legal force to Nixon's earlier orders: it kept price controls in place and shared fuel out in proportion to each buyer's 1972 purchases. If total supply fell to 90 percent of the 1972 level, each buyer was entitled to 90 percent of what it had received in 1972.3
That rule looks fair on paper, but it ignores where demand had actually moved. A recent economics paper by Brian Albrecht, Alex Tabarrok and Mark Whitmeyer (https://arxiv.org/abs/2602.12066) uses a survey of gasoline stations by the American Automobile Association (AAA) from February 1974. The national gasoline shortfall was roughly 9 percent that month.3 If every market had lost 9 percent, the pain would have been thin. Instead, in the AAA survey about 10 percent of stations were out of fuel, 27.6 percent were limiting purchases and 62.3 percent were operating normally. In Connecticut and Massachusetts, more than 90 percent of sampled stations were rationing, while in Idaho, Montana, Utah, Hawaii and Wyoming none reported problems. Lines in Maryland and Connecticut stretched up to five miles.3
The authors' argument is that when the price is capped, a supplier earns the same revenue wherever it ships. In a free market, a city short of fuel would pay more, and that premium would pull tankers toward it. Under a cap there is no premium, so a small difference in shipping cost, or a regulator's choice, can send whole cargoes to the wrong place. In their calibration, the resulting losses were between 1 and 9 times the loss that a simple textbook price ceiling would predict.3 That textbook loss assumes shortages are shared evenly across markets, which is not what the survey found.
What do economists still dispute?
The fair counterargument is that the embargo was a real supply cut, and the world price rose whether or not the United States had controls. Without any domestic caps, Americans would still have paid far more at the pump, and some people would still have gone without. A cap has an obvious appeal: it keeps prices lower for households at a time of rapid inflation. Nothing in the evidence above says the shock would have been painless without controls.
What the evidence does support is narrower. The size and unevenness of the shortage is hard to explain by the supply cut alone. But the 2026 paper rests on modelling choices, and its 8 to 9 percent shortfall figure comes from a linear trend fitted to 1970 to 1973 data rather than a direct count of missing barrels.3 Economists also still argue about how much of the lasting inflation of the 1970s came from the oil price and how much from monetary policy. The Federal Reserve's own history notes that policymakers at the time tended to see this kind of cost-push inflation as beyond what interest rates could influence.1
What changed afterwards?
Three changes stand out. First, the United States built a stockpile. The Energy Policy and Conservation Act of 1975 created the Strategic Petroleum Reserve, authorised at up to one billion barrels, in response to the embargo.4 Second, importing nations created the International Energy Agency, whose members agree to hold oil stocks equal to 90 days of the previous year's net imports.4 Both aim to cushion a future cutoff without needing rationing.
Third, the price controls were dismantled, but slowly. On January 28, 1981, President Reagan signed Executive Order 12287, which exempted all crude oil and refined petroleum products from the price and allocation controls set up under the 1973 Act.5 The text of the order itself (https://www.presidency.ucsb.edu/documents/executive-order-12287-decontrol-crude-oil-and-refined-petroleum-products) kept some smaller allocation programmes running until March 31, 1981, so even then the unwinding was not instant.5
What is not known?
It is not known exactly how many gasoline lines would have formed under free prices, because that world never existed. Estimates depend on assumptions about consumer behaviour and how fast the market would have adjusted. The AAA survey is a snapshot from one month, not a daily record. None of the sources used here offers an agreed split between the embargo, the dollar devaluations and the controls.
The lesson is limited but real. A price cap can feel fair while hiding its cost in queues, closed stations and fuel sent to the wrong place. A higher price hurts too, and the evidence here does not say which is better for any household. It says that holding a price down does not make the scarcity go away. The Federal Reserve's essay on the oil shock (https://www.federalreservehistory.org/essays/oil-shock-of-1973-74) gives the wider story.
Key takeaways
- The 1973 oil shock began with an Arab embargo on the United States announced on October 19, 1973, and the price of oil nearly quadrupled by January 1974.
- U.S. price and allocation controls kept pump prices below the market level and shared fuel by 1972 purchase shares, which helped create very uneven shortages.
- In February 1974 the shortfall was about 9 percent nationally, but more than 90 percent of sampled stations in Connecticut and Massachusetts were rationing while several western states reported none.
- Economists still debate how much of the damage came from the embargo and how much from controls; both matter.
- The episode led to the Strategic Petroleum Reserve, the International Energy Agency and, in 1981, the end of federal oil price controls.
Sources
- 1Oil Shock of 1973-74 (opens the source in a new tab) · Federal Reserve Bank / Board of Governors, 2013 · Report · https://www.federalreservehistory.org/essays/oil-shock-of-1973-74
- 2The Great Inflation (opens the source in a new tab) · Federal Reserve History (Federal Reserve Board), 2013 · Primary source · https://www.federalreservehistory.org/essays/great-inflation
- 3Chaos and Misallocation under Price Controls (opens the source in a new tab) · arXiv (econ.GN), 2026 · Paper · https://arxiv.org/abs/2602.12066
- 4The Strategic Petroleum Reserve: Authorization, Operation, and Drawdown Policy (opens the source in a new tab) · Congressional Research Service, 2017 · Report · https://www.everycrsreport.com/reports/R42460.html
- 5Executive Order 12287: Decontrol of Crude Oil and Refined Petroleum Products (opens the source in a new tab) · The American Presidency Project, UC Santa Barbara, 1981 · Primary source · https://www.presidency.ucsb.edu/documents/executive-order-12287-decontrol-crude-oil-and-refined-petroleum-products