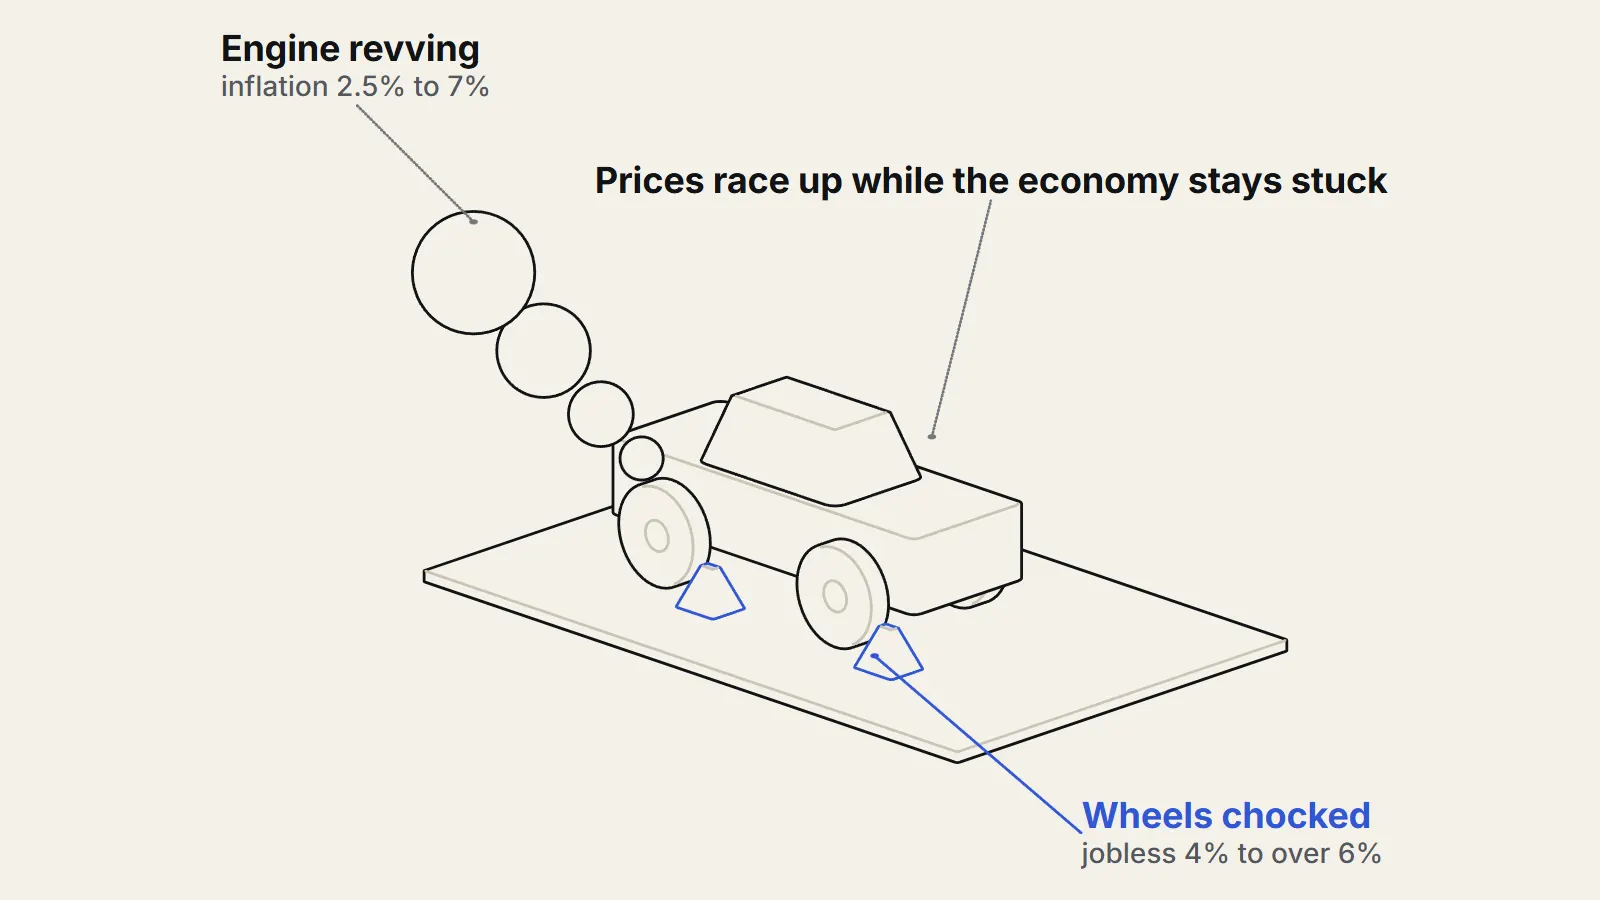
Stagflation is the unusual combination of stagnant output, high unemployment and high inflation at the same time. It matters because, until the 1970s, many economists and policymakers believed that high inflation and high unemployment should not occur together: if one was high, the other should be low. The 1970s showed otherwise, and the way the episode ended reshaped how central banks (https://therealigned.com/story/what-a-central-bank-does) think about inflation.
What is stagflation?
The word joins "stagnation" and "inflation." In plain terms, the economy is stuck or shrinking, jobs are scarce, and prices are still rising quickly. The Reserve Bank of Australia describes the 1970s as a decade of stagflation, meaning stagnant output together with high inflation, and links it to the October 1973 OPEC oil embargo, after which oil prices quadrupled.1 A Richmond Fed article by Robert King defines it as a simultaneous rise of unemployment and inflation.2
Why did stagflation break the inflation-unemployment trade-off?
The trade-off in question is the Phillips curve. In 1958 A. W. Phillips reported an inverse relationship between wage inflation and unemployment in UK data from 1861 to 1957, and in 1960 Paul Samuelson and Robert Solow helped turn the idea into a menu of policy choices for the United States.3 In the US data of the 1960s, cutting unemployment from 6 to 5 percent cost a little over half a percentage point of extra inflation, according to the Econlib summary.3 King adds that a long-run trade-off was built into most prominent policy models as of 1969.2
Two economists, Milton Friedman and Edmund Phelps, argued the menu could not last. Friedman put it in his 1968 paper "The Role of Monetary Policy" in the American Economic Review: there is always a temporary trade-off between inflation and unemployment; there is no permanent trade-off4. The temporary trade-off comes from unanticipated inflation, he said, and a rising rate of inflation may reduce unemployment while a high rate will not.4 In short, once workers and firms expect inflation, they build it into wages and prices, and policymakers who try to hold unemployment down have to deliver ever more inflation to get the same effect.
The Econlib summary reports that average inflation rose from about 2.5% in the 1960s to about 7% in the 1970s3 and that unemployment, instead of falling, rose from about 4% to above 6%, a result it calls a striking confirmation of Friedman and Phelps.3 King describes the empirical Phillips curve breaking down from 1969 to 1979, with intervals in which unemployment and inflation rose together.2
What caused 1970s stagflation?
No single factor explains it. The Federal Reserve's own history points to a mix: policymakers pursued full employment on the assumption of a stable trade-off, the dollar's link to gold collapsed, Great Society and Vietnam War spending strained the budget, and the 1973 and 1974 oil embargo quadrupled crude prices while the 1979 Iranian revolution tripled them again.5 Oil matters for the stagflation story because it raises costs for nearly every business. Output falls and prices rise, a supply shock that standard demand-side tools cannot fix, since cutting interest rates to support jobs adds to inflation and raising them to fight inflation adds to unemployment.
Expectations were the amplifier. The Fed history says that by the late 1970s the public expected an inflationary bias in policy and that inflation expectations had become entrenched. It adds that the warnings of Phelps and Friedman proved accurate as the trade-off between unemployment and inflation worsened.5
How did stagflation end?
Paul Volcker became Fed chairman in August 1979, and in October of that year the Fed shifted to targeting the growth of bank reserves instead of the federal funds rate (https://therealigned.com/story/how-the-fed-sets-interest-rates).5 Two recessions followed, a brief one in 1980 and a deeper one from July 1981 to November 1982, and unemployment peaked near 11 percent. By the end of the second recession inflation was back under 5 percent.5
King cites a textbook calculation by economist Gregory Mankiw. With inflation falling from 9.7 percent in 1981 to 3 percent in 19852, and unemployment averaging 9.5 percent in 1982 and 1983, the calculated sacrifice ratio was about 1.5, roughly half the figure suggested by earlier estimates by Arthur Okun.2 King concludes that the disinflation, though costly, involved smaller unemployment losses than consensus forecasters had predicted, as analysts who stressed rational expectations had suggested.2
What is disputed?
The strongest counterargument concerns what stagflation really was. The textbook story gives oil shocks a leading role. A Dallas Fed article argues the opposite: that oil was a symptom of inflation, not its root cause, because real oil prices fell through the 1960s and early 1970s and a global boom driven by earlier monetary expansion lifted commodity demand.6 On this view, the stagflation of the 1970s was mostly a product of monetary policy, with oil making a bad situation worse.
There is also disagreement about the cost of ending it. Mankiw's calculation depends on an assumed natural rate of unemployment of 6 percent during 1982 to 1985, and King notes that one can argue about the details, including when the disinflation should be said to have started.2
What is not known?
Economists still debate how much of the 1970s outcome came from bad luck and how much from bad policy, and they have not settled how quickly expectations adjust. The Fed history also notes that policymakers worked with data that overstated how much the economy could produce.5 This article explains an episode and the mechanisms behind it. It is not advice about money or investments. For the sources, see the Richmond Fed article by King (https://www.richmondfed.org/-/media/richmondfedorg/publications/research/economic_quarterly/2008/fall/pdf/king.pdf) and Friedman's 1968 paper (https://fraser.stlouisfed.org/files/docs/publications/aer/aer_1968_friedman_role_monetary_policy.pdf).
Key takeaways
- Stagflation means weak output and high unemployment together with high inflation.
- It broke the idea of a lasting trade-off between inflation and unemployment, as Friedman and Phelps had warned.
- Oil shocks, policy choices and entrenched expectations all played a part, and economists weigh them differently.
- It ended after the Fed under Volcker tightened sharply from 1979, at the cost of two recessions.
- The cost of ending it was lower than many forecasters had predicted, though still severe.
Sources
- 1Causes of Inflation (opens the source in a new tab) · Reserve Bank of Australia, 2024 · Primary source · https://www.rba.gov.au/education/resources/explainers/causes-of-inflation.html
- 2The Phillips Curve and U.S. Macroeconomic Policy: Snapshots, 1958-1996 (opens the source in a new tab) · Federal Reserve Bank of Richmond Economic Quarterly, 2008 · Paper · https://www.richmondfed.org/-/media/richmondfedorg/publications/research/economic_quarterly/2008/fall/pdf/king.pdf
- 3Phillips Curve (opens the source in a new tab) · Econlib (Concise Encyclopedia of Economics), 2008 · Reporting · https://www.econlib.org/library/Enc/PhillipsCurve.html
- 4The Role of Monetary Policy (opens the source in a new tab) · American Economic Review (via St. Louis Fed FRASER), 1968 · Paper · https://fraser.stlouisfed.org/files/docs/publications/aer/aer_1968_friedman_role_monetary_policy.pdf
- 5The Great Inflation (opens the source in a new tab) · Federal Reserve History (Federal Reserve Board), 2013 · Primary source · https://www.federalreservehistory.org/essays/great-inflation
- 6Lessons from the destabilization of inflation in the 1970s (opens the source in a new tab) · Federal Reserve Bank of Dallas, 2026 · Essay · https://www.dallasfed.org/research/economics/2026/0217