- Place
- Venezuela
- Years
- 2016–2021
- Policy
- Deficits financed by central bank money, exchange and price controls from 2003, financial sanctions from 2017, then currency redenominations and a retreat from controls in 2019.
- Outcome
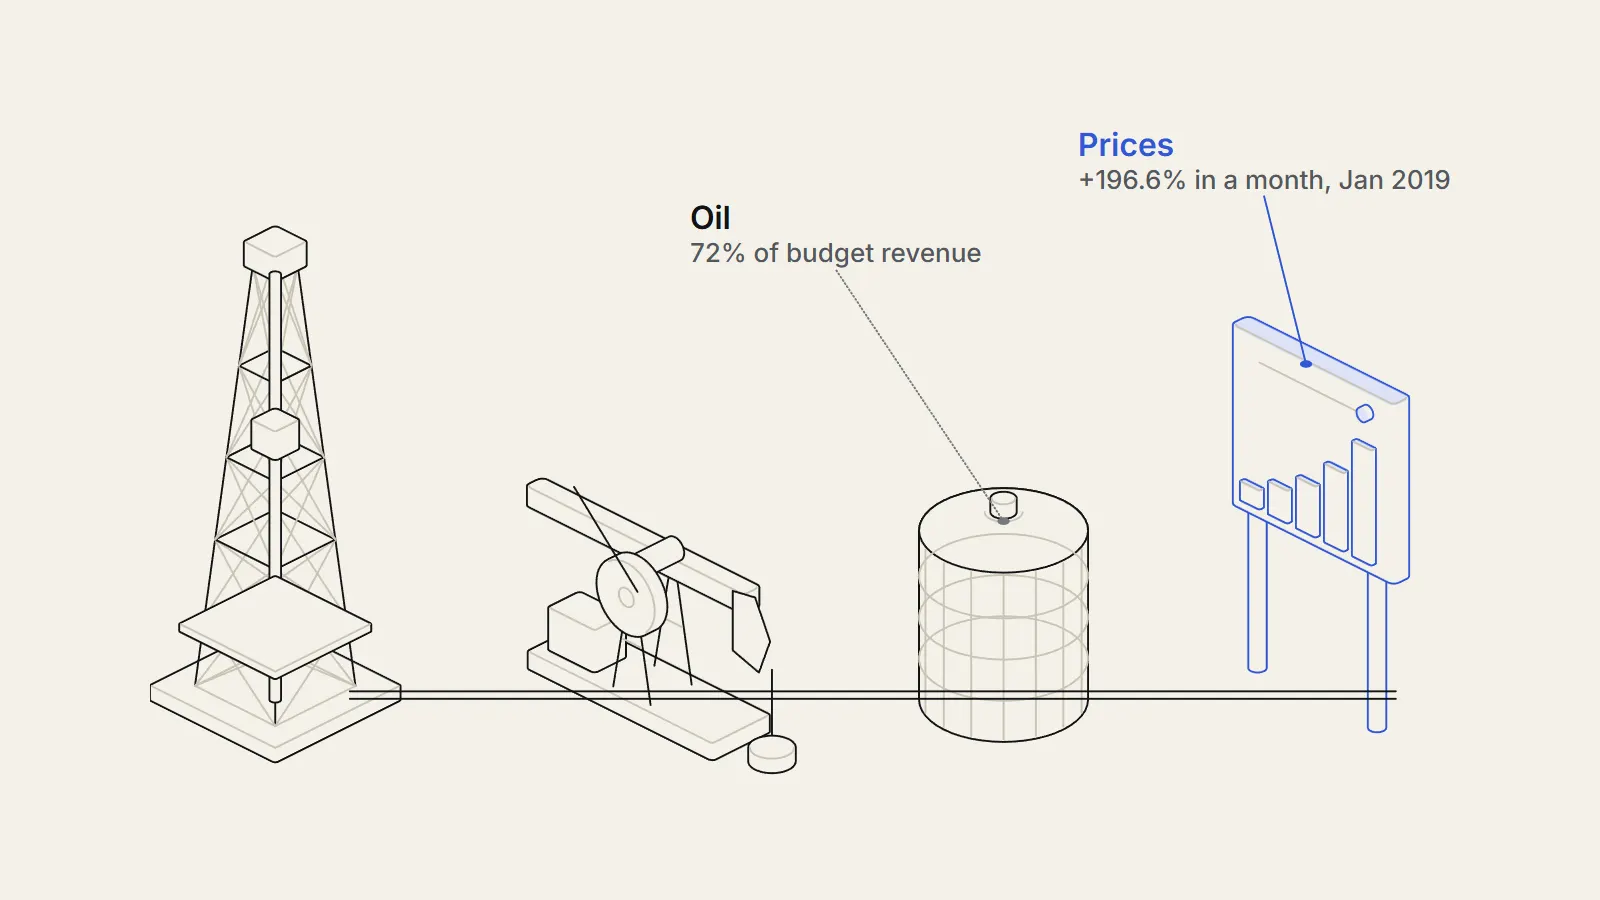
- Monthly inflation peaked at 196.6 percent in January 2019, year-end inflation hit 130,060.2 percent in 2018 and had fallen to 686.4 percent by 2021 on the central bank index.
Venezuela's hyperinflation (https://therealigned.com/story/hyperinflation-how-a-currency-collapses) ran from late 2017 to late 2020 on the central bank (https://therealigned.com/story/what-a-central-bank-does)'s own index: monthly inflation first passed 50 percent in December 2017, reached 196.6 percent in January 20191 and last topped 50 percent in December 2020, according to the Central Bank of Venezuela index (https://www.bcv.org.ve/estadisticas/consumidor).1 Over calendar 2018 prices rose 130,060.2 percent1, and by 2021 the yearly rate had fallen to 686.4 percent, by our calculation from the index.1 The cause is contested, and we set out each side and what the numbers can and cannot show.
Before
An oil economy used to inflation
Venezuela sells oil, and oil still provides 72 percent of its budget revenue, according to the Bertelsmann Transformation Index report for 2026.3 When oil revenue falls, the state has to cut spending, borrow or create money. That choice sits at the centre of the story.
High inflation was not new. Researchers at the Central Bank of Venezuela wrote in 2013 that consumer prices had risen by more than 10 percent a year since 1974, and judged that Venezuelan inflation seemed to respond to structural factors more than to circumstantial ones.4 From the central bank's index we calculate year-end inflation of 30.9, 25.1, 27.2, 27.6 and 20.1 percent for 2008 to 2012.1 Those are high rates by rich-country standards, but they are tens of percent, not hundreds.
Exchange controls, rationing and money creation
In February 2003, after the bolívar lost 47 percent of its value between December 2002 and January 2003, the government introduced exchange controls with a single official rate.5 A commission called CADIVI ran the system: export earnings had to be sold to the central bank at the official rate, and buying foreign currency for imports needed approval.5 Price controls on basic goods followed, covering 45 basic goods and 7 services under one decree.5
The economist Marta Kulesza argues that the external squeeze became severe in the second half of 2012, when the current account surplus fell to 0.8 percent of GDP and foreign exchange allocations to private firms were rationed hard.5 Her account is that the black-market dollar then rose fast, and firms priced goods as if the bolívar were weaker than the official rate, which pushed inflation up.5
Kulesza adds a second pressure, which she calls distributive conflict. In her account, rationing led to a regressive shift in the distribution of income, workers opposed cuts in real wages, and the conflict fed inflation further.5 In her reading, rationing foreign currency also created shortages of imported inputs, because many Venezuelan sectors depend on them to produce.5
A third strand concerns the central bank. Victor Olivo notes that at the end of 2009 a reform of the central bank law, passed by a legislature controlled by the executive, allowed the bank to buy securities issued by the state oil company PDVSA directly. He calls this the essential mechanism used to finance the public sector and expand the monetary base.6
The real economy weakened at the same time. Brookings researchers report that Venezuela's daily oil output fell 24 percent between 2005 and 2016, and that food imports dropped 71 percent from their 2013 peak to 2016, with medicine imports down 68 percent.7 World Bank data show GDP shrinking by 3.9 percent in 2014, 6.2 percent in 2015, 17.1 percent in 2016 and 15.7 percent in 2017.2
Inflation was already climbing before it crossed the 50 percent monthly line. Olivo reports that the year-on-year rate entered three digits in July 2015 and ended that year at 180.9 percent, then reached 274.4 percent in 2016 and 862.6 percent in 2017.6
The decision
No single decision: controls, money and a late retreat
Unlike a one-day policy, the Venezuela hyperinflation followed a chain of choices over fifteen years. The 2003 exchange and price controls were one link, and the 2009 change to the central bank's powers another.56 Later came two currency redenominations and, from 2019, a reversal of earlier controls.
Reuters reported in August 2021 that the central bank would cut six zeros from prices from October 1 of that year. It was the second overhaul in three years: President Nicolás Maduro had cut five zeros in 2018, and Hugo Chávez's 2008 overhaul had cut three.8 Removing zeros changes the way prices are written, not the pace at which they rise. The same report says that much of the economy has been dollarized since Maduro largely scrapped currency and price controls in 2019.8
What counts as hyperinflation, and how money feeds it
Economists usually follow Phillip Cagan's definition: inflation above 50 percent in a month. Weisbrot and Sachs note that this equals about 13,000 percent in a year.9 The measure matters because a calendar-year figure hides how fast prices move inside the year. A price index that rises 50 percent a month more than doubles in two months.
The monetary account runs as follows, in our plain-language summary. If the state pays its bills with newly created money, the money supply grows faster than output and prices rise. People then hold less money, spending it quickly, so each new bolívar buys less, and the state needs to create still more to buy the same things. Olivo tests this for Venezuela and finds that the demand for money was stable in Cagan's sense, so the impulse came from the supply side.6
- 1974 onwardConsumer prices rise more than 10 percent a yearSource 4 (opens the source in a new tab)
- Feb 2003Exchange controls with one official rate begin; CADIVI is createdSource 5 (opens the source in a new tab)
- End of 2009Central bank law reform lets the bank buy PDVSA securities directlySource 6 (opens the source in a new tab)
- Second half of 2012Drastic rationing of foreign exchange to private firms beginsSource 5 (opens the source in a new tab)
- July 2015Year-on-year inflation enters three digitsSource 6 (opens the source in a new tab)
- Aug 25, 2017US financial sanctions announcedSource 7 (opens the source in a new tab)
- Dec 2017Monthly inflation passes 50 percent for the first time (55.6 percent)Source 1 (opens the source in a new tab)
- 2018Five zeros cut from the currencySource 8 (opens the source in a new tab)
- Jan 2019Monthly inflation peaks at 196.6 percentSource 1 (opens the source in a new tab)
- 2019Currency and price controls largely scrapped; dollarization spreadsSource 8 (opens the source in a new tab)
- Dec 2020Last month above 50 percent (77.5 percent)Source 1 (opens the source in a new tab)
- Oct 1, 2021Six zeros cut from pricesSource 8 (opens the source in a new tab)
Two opposite cases against the standard story
Because the episode is political as well as economic, we state the two strongest objections side by side. They point in opposite directions, and each is held by serious people.
very likely the main shock that pushed the economy
— Weisbrot and Sachs, CEPR, April 2019
The two cases are not strictly exclusive. A country can have a monetised deficit and also suffer an external shock. The dispute is about timing and weight, and we come back to it below.
What happened
The Venezuela inflation rate, year by year
The central bank's index gives the clearest record. It is published as a monthly series by the bank and the national statistics institute, and we calculated year-end changes from its levels. Our figures for 2015 to 2019 match the ones Olivo reports from the same source.16
| Year | Dec to Dec inflation | Highest monthly rate | Months above 50% |
|---|---|---|---|
| 2015 | 180.9% | 12.4% (Aug) | 0 |
| 2016 | 274.4% | 19.2% (Jun) | 0 |
| 2017 | 862.6% | 55.6% (Dec) | 1 |
| 2018 | 130,060.2% | 127.7% (Sep) | 10 |
| 2019 | 9,585.5% | 196.6% (Jan) | 3 |
| 2020 | 2,959.8% | 77.5% (Dec) | 2 |
| 2021 | 686.4% | 46.6% (Jan) | 0 |
Olivo, who dates the episode from December 2017 to January 2020, reports that monthly inflation averaged 67.36 percent in that window and that the year-on-year rate peaked at 344,509.5 percent in February 2019.6 That is a rate at which prices double in a little over a month.
Money growth moved with prices. Olivo reports that the monthly growth rate of the monetary base stayed above 50 percent for eight months of 2018 and passed 100 percent in July, September and December. The highest rate in 2018 was 110.7 percent in September, and 131.3 percent in January 20196 was the highest of the whole period, falling to 104.2 percent in February.6 From April 2019 to January 2020 base money growth stayed under 50 percent, though above 40 percent in August, October and November 2019.6 Olivo reports a regression coefficient close to one between monthly base money growth and monthly inflation during the episode, with a 95 percent bootstrap interval of 0.68 to 1.34, against 0.074 in the milder period of January 2015 to November 2017. He also finds that base money growth helps explain changes in the nominal exchange rate, which he reads as money leading the currency.6 A regression on one monthly series cannot rule out feedback in the other direction, and Kulesza's account above puts the black-market rate first.
Output and the end of the Venezuela hyperinflation
Output fell throughout. World Bank data show contractions every year from 2014 to 2020, reaching 27.6 percent in 2019 and 29.8 percent in 2020, then growth of 0.6 percent in 2021.2 Compounding those yearly rates from 2014 to 2020 gives a fall of about 74 percent, by our calculation. Olivo, using the official figures available, reports a 47.29 percent contraction from 2015 to 2018.6 The two numbers cover different periods and series and should not be compared directly.
What ended the worst of it? The Bertelsmann report credits de facto dollarization, limits on public spending and some fiscal discipline.3 Reuters ties dollarization to the 2019 decision to scrap most currency and price controls.8 Both are descriptions, not tests, and neither source measures how much each factor contributed.
When did it officially end? The report says the central bank recorded December 2020 as the last month above 50 percent.3 Caracas Chronicles, writing in September 2021, applied Cagan's exit rule of twelve straight months below 50 percent and counted the episode as still running at 45 months.10 On the monthly series we opened, all twelve months of 2021 stayed below 50 percent, so that rule would be met by December 2021. That reading is ours, and it explains why we frame the episode as 2016 to 2021: prices were accelerating from 2016, and the Cagan-style exit lands in 2021.
Lower did not mean low. On the same index we calculate December-to-December inflation of 234.1 percent in 2022 and 189.8 percent in 2023, against the Bertelsmann report's figure of 190 percent for 2023.13 For 2024 the index gives 48.0 percent while the report, citing the IMF, gives 71.7 percent, and we cannot say why they differ. Monthly inflation rose again in late 2025, to 25.9 percent in October and 21.6 percent in November, and the index shows 32.6 percent in January 2026.1 The report links the return of oil sanctions in early 2025 to renewed inflation, without giving a figure.3
The 2021 article in Caracas Chronicles lists what was still pushing prices that year: legal reserve requirements that drained bank liquidity, price controls, a cut of about 600 tariff lines that might cause shortages and renewed price rises, and pre-election bonuses and a planned minimum wage increase that would add money to a limited supply.10 It also counts three revaluations of the currency in 13 years, which removed 14 zeros.10 The Reuters report quotes the economist Luis Oliveros remarking that eleven zeros had been eliminated in three years.8
What economists still disagree on
What caused Venezuela inflation to explode, and how reliable are the data?
The sanctions debate is where the evidence is thinnest. Bahar and colleagues at Brookings and Harvard answered Weisbrot and Sachs in a May 2019 policy brief (https://www.brookings.edu/wp-content/uploads/2019/05/impact-of-the-2017-sanctions-on-venezuela_final.pdf). They argue that no proper counterfactual exists and that economic trends after the sanctions cannot be separated from the powerful negative trends before them.7 In their words, the bulk of the deterioration in living standards occurred long before the sanctions.7
Their evidence is partly about money and partly about oil. The Venezuelan sovereign bond spread averaged 2,884 basis points7 in the 30 trading days before August 25, 2017, 7.8 times the Latin American average, so markets had effectively shut the government out already.7 They also say analysts trace the oil decline to the firing of more than 18,000 oil workers after the 2003 strike, and note that OPEC output excluding Venezuela did not fall after January 2016 while Venezuela's did.7 Weisbrot and Sachs, for their part, accept that the economy was in recession and that inflation ran at 758 to 1,350 percent a year when the sanctions came, and write that we can never know the counterfactual.9
The causal question is therefore open. Both sides agree that inflation was already very high in 2017. They differ on whether the 2018 acceleration to 130,060.2 percent was mainly the delayed result of money creation or mainly a response to a new loss of dollars. The index shows when prices moved, not why.
Dating, duration and level: three data disputes
Dating. Olivo says the episode ended in January 2020, with twelve months below 50 percent following. The central bank spreadsheet we opened shows 77.5 percent in December 2020, and both the Bertelsmann report and Caracas Chronicles cite that figure.61310 We cannot tell whether the paper used an earlier release of the series.
Duration. Caracas Chronicles says Nicaragua holds the record at 58 months, citing Hanke and Krus; Olivo, citing Sachs and Larraín, gives 48 months for Nicaragua and calls Venezuela the second longest.106 Whether Venezuela is the longest depends on where each episode starts and ends.
Level. Reuters says inflation hit 1.8 million percent in 2018, while the central bank index gives 130,060.2 percent for December-to-December 2018.81 The Reuters report does not say whose estimate it cites, and we could not reconcile the two. Official GDP data are also thin for these years, so the World Bank rates for 2016 to 2019 should be read as estimates.
The accounts also read the same facts differently. In Kulesza's framework a hyperinflation requires a flight from the national currency into foreign currency, and she wrote in 2017 that tight exchange controls had so far prevented it.5 The dollarization that Reuters and the Bertelsmann report describe from 2019 looks, to us, like the missing step in her sequence, although neither of those sources uses her framework and we cannot say it confirms it. Olivo reads the same episode as a classic money-supply event, in which a sharp fall in real money balances showed that prices were rising faster than the money stock.6
- Agreed in the sources: inflation was very high before 2017, the monthly rate passed 50 percent in December 2017, and much of the economy had dollarized by 2021.
- Disputed: how much of the acceleration came from central bank money creation, from exchange rationing and controls, and from the loss of credit and oil income after 2017.
- Disputed: when the episode ended, how long it lasted, and which annual inflation figure is right for 2018.
- Not known: what the 2018 path would have been under a different policy or without the sanctions.
How much of the 2018 explosion would have happened had oil output and credit access stayed at their 2016 levels, and could any dataset settle the question?
Lessons
Key takeaways
- In the accounts of Olivo, Kulesza, Reuters and the Bertelsmann report, the state paid a large part of its bills with central bank money, and the monetary base grew at around 56 percent a month on average through the peak.
- Controls masked rather than removed the pressure: rationed dollars and capped prices produced a black-market rate and shortages, which fed further inflation in Kulesza's account.
- The episode ended with a retreat from controls and widespread dollarization, not with a single plan, and high inflation returned in the years after.
- Even with the central bank's own index, the dating, duration and level of the hyperinflation are disputed, so every headline number needs its source and measure.
What carries over is the mechanism: when governments cannot borrow and pay with new money, and when an official exchange rate diverges from the market rate, price rises can quicken from tens to hundreds of percent. What may not carry over is the oil dependence and the sanctions context, which few countries share. We have not covered the humanitarian effects here, which need their own evidence.
Sources
- 1Indice Nacional de Precios al Consumidor, serie desde diciembre 2007 (base diciembre 2007 = 100) (opens the source in a new tab) · Banco Central de Venezuela (BCV), 2026 · Primary source · https://www.bcv.org.ve/sites/default/files/precios_consumidor/4_5_7.xls
- 2World Development Indicators: GDP growth (annual %), Venezuela, RB (opens the source in a new tab) · World Bank (WDI database, last updated 2026-10-08), 2026 · Primary source · https://api.worldbank.org/v2/country/VEN/indicator/NY.GDP.MKTP.KD.ZG?format=json&date=2012%3A2023
- 3BTI 2026 Country Report: Venezuela (opens the source in a new tab) · Bertelsmann Transformation Index, 2026 · Report · https://bti-project.org/en/reports/country-report/VEN
- 4Inflacion y variacion de precios relativos en Venezuela (Documento de Trabajo No. 144) (opens the source in a new tab) · Banco Central de Venezuela, 2013 · Primary source · https://www.bcv.org.ve/system/files/publicaciones/docu144.pdf
- 5Inflation and hyperinflation in Venezuela (1970s-2016): a post-Keynesian interpretation (opens the source in a new tab) · Institute for International Political Economy Berlin, Working Paper 93/2017, 2017 · Paper · https://www.boeckler.de/pdf/v_2017_11_10_kulesza.pdf
- 6Hyperinflation in Venezuela. An Analysis Based on Cagan's Conceptual Framework (opens the source in a new tab) · MPRA Paper No. 119195 (Munich Personal RePEc Archive), 2023 · Paper · https://mpra.ub.uni-muenchen.de/119195/
- 7Impact of the 2017 sanctions on Venezuela: Revisiting the evidence (opens the source in a new tab) · Brookings Institution (Policy Brief), 2019 · Report · https://www.brookings.edu/wp-content/uploads/2019/05/impact-of-the-2017-sanctions-on-venezuela_final.pdf
- 8Venezuela to cut six zeros from prices amid hyperinflation (opens the source in a new tab) · Reuters (via Yahoo Finance), 2021 · Reporting · https://www.yahoo.com/news/1-venezuela-cut-six-zeros-131227432.html
- 9Economic Sanctions as Collective Punishment: The Case of Venezuela (opens the source in a new tab) · Center for Economic and Policy Research, 2019 · Report · https://cepr.net/images/stories/reports/venezuela-sanctions-2019-04.pdf
- 10Heading to the Longest Hyperinflation in History (opens the source in a new tab) · Caracas Chronicles, 2021 · Reporting · https://www.caracaschronicles.com/2021/09/07/heading-to-the-longest-hyperinflation-in-history/