- Place
- United States
- Years
- 1979–1982
- Policy
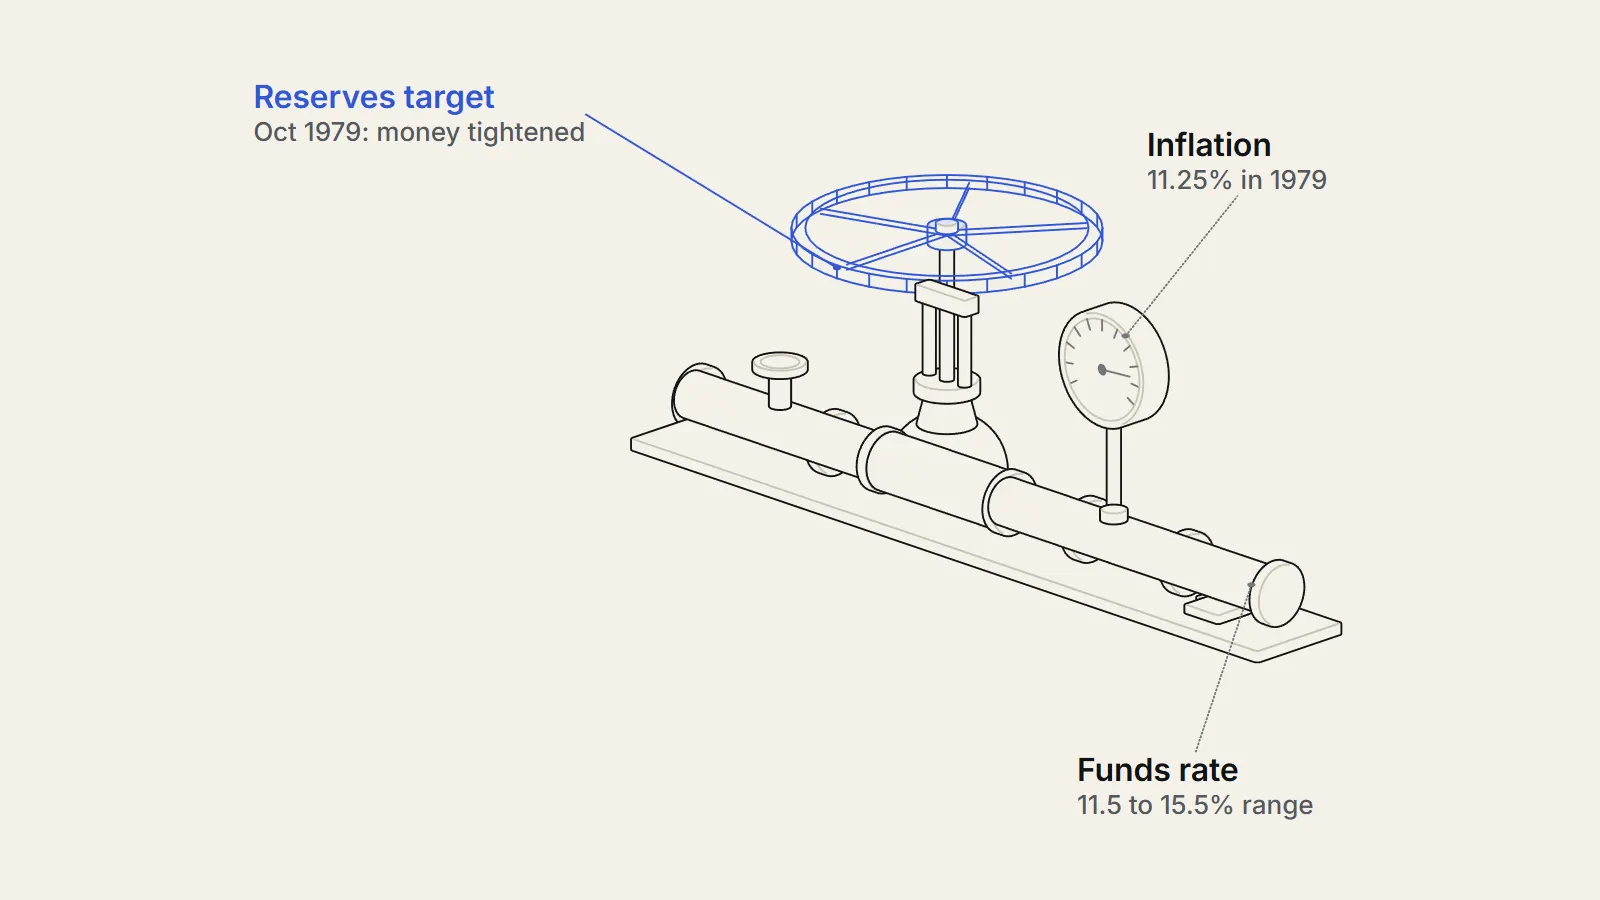
- On 6 October 1979 the Fed shifted from steering the federal funds rate to managing bank reserves, then held tight policy through two recessions until it eased in mid-1982.
- Outcome
- Annual consumer price inflation fell from 13.55 percent in 1980 to 3.21 percent in 1983, while unemployment rose from 6.0 to 10.8 percent between December 1979 and December 1982.
The Volcker inflation fight of 1979 to 1982 was the US Federal Reserve’s decision to squeeze money and credit until a decade-long price spiral broke. Annual consumer price inflation fell from 13.55 percent in 1980 to 3.21 percent in 19831, but unemployment climbed to 10.8 percent in November and December 19822. Whether the price was worth paying, and whether it could have been lower, is still argued.
Before
The Great Inflation: how prices got away
In 1964 US inflation was a little over 1 percent a year and unemployment about 5 percent. By around 1974 inflation had passed 12 percent and unemployment 7 percent.4 The Federal Reserve’s own history of the period names several causes at once, which is why we are cautious about any single story.
The list includes money growth (https://therealigned.com/research/money-supply-growth-and-inflation) that the Fed allowed, the end of the dollar’s link to gold in 1971, wage and price controls from 1971 to 1974, budget strain from the Vietnam War and the Great Society, and oil shocks: crude prices quadrupled during the 1973-74 embargo and roughly tripled again after the 1979 Iranian revolution.4 The essay adds a policy mistake that matters for what follows. Officials believed in a stable trade-off between unemployment and inflation, known as the Phillips curve, and used a little more inflation to buy a little less unemployment.4
Two further weaknesses compounded the problem. The Fed’s "even-keel" practice limited its ability to change policy around Treasury debt issues, and research by Athanasios Orphanides found that policymakers of the time overestimated potential output and underestimated the unemployment rate consistent with full employment.4 The essay lists both among the reasons inflation was allowed to build.
That trade-off holds only while people do not expect prices to keep rising. Economists Edmund Phelps and Milton Friedman warned that once expectations adjust, the trade-off shifts, and the Fed’s history says they were right.4 In plain terms, if workers and firms assume 10 percent inflation, they build it into wage bargains and price lists, and inflation feeds itself.
Before the Volcker inflation fight began, annual consumer price inflation, on the World Bank series, ran 5.74 percent in 1976, 7.63 percent in 1978 and 11.25 percent in 1979.1 When Paul Volcker took office as Fed chairman in August 1979, inflation was above 11 percent and unemployment just under 6 percent.4 Different price indexes give different peaks, so we state which one we use each time: the Fed’s own essays quote 11.6 percent for March 1980 on one measure and nearly 15 percent on another.54
The committee that met on 6 October 1979 was not reacting to a recession. The staff told it that unemployment had dipped to 5.8 percent in September, yet projected real output to fall at a 3.5 percent annual rate in the fourth quarter.6 Volcker described financial markets as "as nervous as I have ever seen them" and said price expectations had "certainly gotten worse rather than better".6
The decision
What the Fed changed on 6 October 1979
President Jimmy Carter nominated Volcker to lead the Fed and G. William Miller, the outgoing chairman, to run the Treasury.5 At his confirmation hearing in July 1979 Volcker said the Fed would "have to call the shots as we see them" and that money was growing "at a pretty good clip".5 A Treasury official said that interest-rate cuts would come once unemployment reached 7 percent, and the new chairman took office with unemployment still just under 6 percent.54
Before that day the Fed steered by choosing a narrow target range for the federal funds rate (https://therealigned.com/story/how-the-fed-sets-interest-rates), the rate at which banks lend reserves to each other overnight. After it, the committee said it would manage the volume of bank reserves instead5 and let the funds rate move more widely.5 The idea was to hold down money growth directly, and Volcker told the press the Fed thought it "can get firmer control over the growth in money supply in a shorter period of time".5
The Volcker inflation fight began with a decision made by people who knew the risks, as the published transcript (https://www.federalreserve.gov/monetarypolicy/files/FOMC19791006meeting.pdf) shows. Volcker reported a colleague’s remark that two dangers, runaway inflation on one side and recession on the other, "have now come together" and said no course was risk-free.6 He also refused to bind the Fed to a mechanical rule that would hit a reserves figure "come hell or high water" whatever the interest rate, keeping the committee’s discretion over the weekly path.6
Part of the urgency was financial. Volcker said the foreign exchange market had been in a situation "clearly not amenable for very long" to intervention, and he recounted that rumours had circulated in the market the previous day that he had resigned and then that he had died.6 He read the psychology of traders as ready to "crack open" depending on what came out of the meeting.6
I certainly conclude from all of this that we can’t walk away today without a program that is strong in fact and perceived as strong in terms of dealing with the situation.
— Paul Volcker, Fed chairman, FOMC meeting of 6 October 1979 (lightly edited transcript)
- The operating target moved from the federal funds rate to bank reserves, which implied far more volatile short-term rates.
- The committee wrote down a federal funds range of 11.5 to 15.5 percent for the record, with a warning that a rate near the top would trigger a consultation.
- The meeting discussed a discount rate of 12 percent, with the chairman answering "I think that’s obvious" when asked, and a marginal reserve requirement of 5 to 10 percent on a basket of managed liabilities.
The new procedure did not run on autopilot. Early in 1980 the government introduced credit controls and Congress passed the Monetary Control Act, and a brief recession followed from January to July 1980.4 As unemployment rose the Fed eased, then tightened again, a stop-go pattern the Fed’s history describes.7
The second round was harder. The federal funds rate approached 20 percent in late 1980 and early 1981, and on the monthly series the peak was 19.10 percent in June 19813.3 The ten-year Treasury rate climbed from about 11 percent in October 1980 to more than 15 percent a year later, and the monthly series peaked at 15.32 percent in September 1981.78
- Aug 1979Paul Volcker takes office as Fed chairmanInflation was above 11 percent and unemployment just under 6 percent.Source 4 (opens the source in a new tab)
- 6 Oct 1979Unscheduled FOMC meeting shifts focus to bank reservesThe committee also recorded a federal funds range of 11.5 to 15.5 percent.Source 6 (opens the source in a new tab)
- Early 1980Credit controls introduced; Monetary Control Act passedSource 4 (opens the source in a new tab)
- Jan to Jul 1980Brief recessionSource 4 (opens the source in a new tab)
- Jul 1981 to Nov 1982Second, deeper recessionSource 4 (opens the source in a new tab)
- Jun 1981Federal funds monthly average peaks at 19.10 percentSource 3 (opens the source in a new tab)
- Jul 1982Volcker tells lawmakers the Fed is backing off tight targetsAround the same time House Majority Leader James Wright called for his resignation.Source 5 (opens the source in a new tab)
- Aug 1982Mexico tells US officials it cannot service debt of about $80 billionSource 9 (opens the source in a new tab)
- Dec 1982Unemployment at 10.8 percent, its peak, and inflation under 5 percentSource 2 (opens the source in a new tab)
The strongest case against the squeeze
Criticism was loud and came from across the spectrum. At a 1981 hearing, recorded in the Fed’s own history (https://www.federalreservehistory.org/essays/anti-inflation-measures), conservative Republican George Hansen said, "We are destroying the small businessman. We are destroying Middle America."5 Democrat Frank Annunzio accused the Fed of favouring big business, and Henry Gonzalez threatened a bill to impeach Volcker and most of the other governors.5
Inside the administration, Treasury Secretary Donald Regan told the New York Times in 1981 that if money growth stayed where it was, "you’re going to have a severe recession".5 In the summer of 1982 House Majority Leader James Wright called for Volcker’s resignation after meeting him eight times.5 Farmers protested at the Fed’s headquarters and car dealers sent coffins, according to the same account.5
| Sector | Measure | Figure |
|---|---|---|
| Residential construction | Unemployment at end of 1982 | 22 percent |
| Auto manufacturing | Unemployment at end of 1982 | 24 percent |
| Goods producers | Share of employment | about 30 percent |
| Goods producers | Share of 1982 job losses | about 90 percent |
| All workers | Peak unemployment, late 1982 | nearly 11 percent |
There was an international cost as well. Latin American debt had grown from $29 billion at the end of 1970 to $159 billion at the end of 1978 and $327 billion in 1982, and the Fed’s history says rising interest rates and the world recession made those burdens unsustainable.9 In August 1982 Mexico told US officials it could not service debt of about $80 billion, and sixteen Latin American countries eventually rescheduled.9 The essay does not assign the blame to the Fed alone, and neither do we, but a US squeeze did not stop at the US border.
We have set our course to restrain growth in money and credit. We mean to stick with it.
— Paul Volcker, 1981, quoted in the Fed’s history of the 1981-82 recession
What happened
What the Volcker inflation numbers show
The headline result of the Volcker inflation fight is not in doubt. On the World Bank series, consumer price inflation went from 11.25 percent in 1979 to 13.55 percent in 1980, then 10.33, 6.13 and 3.21 percent in 1981, 1982 and 1983.1 The Fed’s history puts inflation back under 5 percent by the end of 1982 and says it averaged about 3.5 percent in the late 1980s.4
The cost shows in the labour market, on the unemployment series (https://fred.stlouisfed.org/data/UNRATE.txt) that the St. Louis Fed publishes. Unemployment was 6.0 percent in December 1979, 7.2 percent a year later, 8.5 percent in December 1981 and 10.8 percent in December 1982.2 The Fed’s history puts the rate at nearly 11 percent in late 1982, the highest of the post-war era, and says it fell to about 8 percent a year later, by the end of 1983.7 By December 1986 it was 6.6 percent, back near where it began.2
Why long rates lagged the inflation fight
Short-term rates fell fast once the Fed eased. The federal funds December average dropped from 12.37 percent in 1981 to 8.95 percent in 1982.3 The ten-year yield fell more slowly, from 13.72 percent in December 1981 to 10.54 percent in December 1982 and 7.11 percent in December 1986.8
That gap is one piece of evidence for the credibility argument. Bond buyers wanted compensation for inflation they feared might return, and the Fed’s history reads the rise of long rates in 1981 as a sign the market expected the Fed to back down once unemployment grew.7 The tight stance had to be held long enough to change what people expected, not only what prices were doing.
The Fed did ease once the data turned. In July 1982 Volcker told lawmakers the Fed was backing off its tight targets and called a second-half recovery "highly likely", after data showed, in the essay's words, that the recession had bottomed out.5 After inflation fell to about 5 percent by October 1982, the Fed let the funds rate drop to 9 percent.7
Looking back, the Fed’s history reports that Volcker argued inflation and unemployment "go together" over the long run, so that fighting inflation served both halves of the Fed’s mandate, and that unemployment fell and sustained growth returned as the Fed’s credibility grew.4 The labour market recovered in step: unemployment was 8.3 percent in December 1983 and 7.3 percent in December 1984.2
What economists still disagree on
Was the Volcker disinflation avoidable? Where economists differ
Economists agree that the Volcker policy worked on inflation. They disagree on how much it cost, and on whether the cost was a law of nature or the result of a public that did not believe the Fed. The usual yardstick is the sacrifice ratio: the output lost divided by the fall in trend inflation.10 Our chart shows the range of published answers for the Volcker episode.
Laurence Ball lists earlier estimates of 4.2 from Blinder, 2.9 from Sachs, 2.8 from Mankiw and 1.4 from Schelde-Andersen10, and produces his own of 1.8 with quarterly data and 1.9 with annual data.10 The spread is a measure of what the data cannot settle. Mankiw’s 2.8, for example, assumes a 6 percent natural unemployment rate, counts 9.5 points of excess unemployment from 1982 to 1985 and applies an Okun coefficient of two.10 Change any of those judgments and the answer moves.
Ball’s wider evidence cuts against gradualism. In his data set of twenty-eight disinflations the ratio is lower when disinflation is quick, which fits the view, which he attributes to Sargent, that a quick disinflation can be inexpensive because expectations adjust sharply.10 The same chapter warns that common ways of drawing a trend through output "understate or even eliminate recessions": on those methods US output does not fall below trend during the 1980 recession.10 A cost estimate is therefore partly a choice about how to define the recession.
A second dispute is about why the cost arose. Goodfriend and King argued that the Fed needed to acquire credibility for low and stable inflation, and pointed to "inflation scares" in long-term rates, which is the reading we described above.11 Thomas Sargent, commenting on their paper in 2022, noted that they chose not to build a rational-expectations model and could not identify a coherent FOMC decision rule in the record.11 He recalls a Fed governor asking him in 1976 to say what the committee’s rule was, and answering that he could not tell.11 The anecdote dates from three years before the squeeze, but it shows how opaque the Fed’s behaviour looked even to a careful outside observer.
Erceg and Levin offer a different route to a similar conclusion. Their model keeps rational expectations but assumes households cannot tell at once whether a policy shift is permanent. With four-quarter contracts it generates output costs of about 1.7 points per point of inflation removed, close to the estimated cost, and they note that expected inflation began to fall in late 1980 while actual inflation lagged.12 On this reading a large cost can arise even without irrational beliefs.
Our reading of the Volcker inflation evidence is narrower than any of these stories. The unemployment peak came after the Fed had shifted procedure, after credit controls, after a first recession and a stop-go reversal, so the lesson that a firm and well signalled path would have cost less is plausible but untested. No one can run the 1980s again with a different Fed.
The data also limit what we can say about other causes. The Fed’s history lists oil price shocks and wage and price controls among the forces behind the earlier inflation, which means part of the later decline in inflation may reflect factors other than the squeeze.4 The sources we opened do not apportion the fall between them, and we do not attempt it.
How much of the 1981-82 unemployment peak was an unavoidable price of breaking inflation expectations, and how much came from a Fed that the public and the bond market had not yet learned to believe?
Lessons
Key takeaways
- The Fed removed a decade of inflation in about three years: annual consumer price inflation fell from 13.55 percent in 1980 to 3.21 percent in 1983.
- The bill was unemployment of 10.8 percent at the peak, concentrated in goods industries that bore about 90 percent of 1982 job losses.
- Estimates of the output cost per point of inflation removed range from 1.4 to 4.2, so the size of the cost depends on method.
- Credibility was an economic input: long-term rates stayed high while short rates fell, a sign the public still doubted the Fed.
The episode was also not unique in kind. Ball notes that the US recessions of the early 1970s, the mid-1970s and the early 1980s each coincided with falling inflation caused by tight monetary policy.10 Disinflation and recession have gone together before, which is why we treat the Volcker inflation episode as a case of a general trade-off, not a one-off.
What carries over is the mechanism, not the numbers. Where inflation expectations are entrenched, bringing them down tends to need a period of weak demand, and the cost depends partly on how believable the central bank (https://therealigned.com/story/what-a-central-bank-does) is. What does not carry over is the exact path. The early 1980s combined an unusual operating procedure, credit controls, a debt build-up abroad and a specific political setting, so we would not read the 1979-82 sacrifice ratio as a price list for any other country or decade.
Sources
- 1Inflation, consumer prices for the United States (FPCPITOTLZGUSA) (opens the source in a new tab) · Federal Reserve Bank of St. Louis (FRED), from World Bank data, 2026 · Dataset · https://fred.stlouisfed.org/data/FPCPITOTLZGUSA.txt
- 2Unemployment Rate (UNRATE), monthly (opens the source in a new tab) · Federal Reserve Bank of St. Louis (FRED), 2026 · Primary source · https://fred.stlouisfed.org/data/UNRATE.txt
- 3Federal Funds Effective Rate (FEDFUNDS), monthly averages (opens the source in a new tab) · Federal Reserve Bank of St. Louis (FRED), 2026 · Primary source · https://fred.stlouisfed.org/data/FEDFUNDS.txt
- 4The Great Inflation (opens the source in a new tab) · Federal Reserve History (Federal Reserve Board), 2013 · Primary source · https://www.federalreservehistory.org/essays/great-inflation
- 5Anti-Inflation Measures (1979-1982) (opens the source in a new tab) · Federal Reserve History (Federal Reserve Board), 2013 · Primary source · https://www.federalreservehistory.org/essays/anti-inflation-measures
- 6Transcript, Federal Open Market Committee meeting of October 6, 1979 (opens the source in a new tab) · Board of Governors of the Federal Reserve System, 1979 · Primary source · https://www.federalreserve.gov/monetarypolicy/files/FOMC19791006meeting.pdf
- 7The Recession of 1981-82 (opens the source in a new tab) · Federal Reserve History (Federal Reserve System), 2013 · Reporting · https://www.federalreservehistory.org/essays/recession-of-1981-82
- 8Market Yield on U.S. Treasury Securities at 10-Year Constant Maturity (GS10) (opens the source in a new tab) · Federal Reserve Bank of St. Louis (FRED), 2026 · Dataset · https://fred.stlouisfed.org/data/GS10.txt
- 9Latin American Debt Crisis of the 1980s (opens the source in a new tab) · Federal Reserve History (Federal Reserve System), 2013 · Reporting · https://www.federalreservehistory.org/essays/latin-american-debt-crisis
- 10What Determines the Sacrifice Ratio? (opens the source in a new tab) · In N. Gregory Mankiw (ed.), Monetary Policy, University of Chicago Press for NBER, 1994 · Study · https://www.nber.org/system/files/chapters/c8332/c8332.pdf
- 11Rational Expectations and Volcker’s Disinflation (commentary on Goodfriend and King) (opens the source in a new tab) · Federal Reserve Bank of Richmond, Essays in Honor of Marvin Goodfriend, 2022 · Essay · https://www.richmondfed.org/publications/research/goodfriend/sargent
- 12Imperfect credibility and inflation persistence (opens the source in a new tab) · Journal of Monetary Economics 50(4), 2003 · Paper · https://people.bu.edu/rking/EC741stuff/EL03jme.pdf