Summary
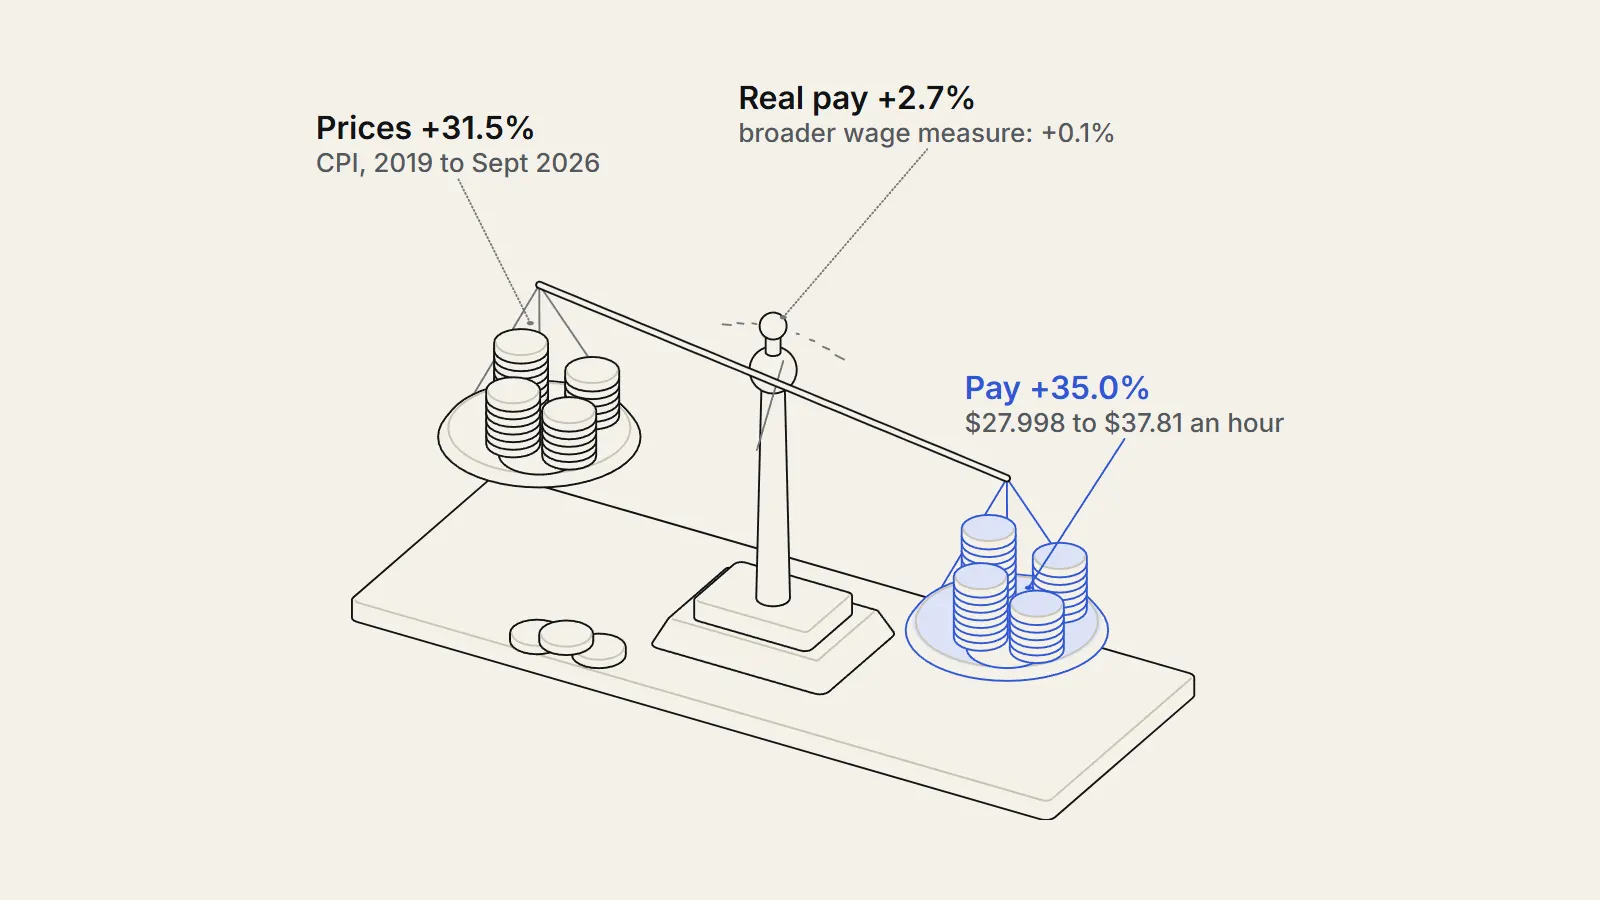
Did prices outrun pay? We compared cpi vs wages since 2019 using US government data, with sixteen price series, three pay measures and several base dates. Average hourly earnings rose 35.0 percent1 from the 2019 average to September 2026 and consumer prices 31.5 percent2. But a broader pay measure, the employment cost index, rose 30.3 percent3 against prices up 30.2 percent, so the answer depends on which wage you pick. Real pay fell year over year in 31 of 80 months.
The question
What are we asking about cpi vs wages since 2019?
The question: since 2019, have wages in the United States risen by more or less than consumer prices? We set the test before looking. We would call the claim that prices outran pay supported if real pay, meaning pay divided by prices with 2019 set to 100, sat below 100 in the latest month on most pay measures. We would call it unsupported if it sat above 100 on most.
It matters because the price surge after 2020 is widely described as a loss of purchasing power. Surveys of public mood often say so, and politicians on different sides use the same year-over-year numbers to reach opposite conclusions. A plain comparison of the series, with the choices made visible, is a useful baseline.
Our hypothesis, fixed before we opened the data, was that prices would have outrun pay, at least for essentials such as food at home and shelter.
What have other studies found?
Three strands of research frame the question. The first is about measurement. In spring 2020, private payrolls fell by 20.9 million jobs, or 16.2 percent, in two months, mostly in low-paying service industries. The Bureau of Labor Statistics notes that this raised the average hourly earnings of the workers who stayed by 5.1 percent, because relatively low-paid workers temporarily left payrolls.4 The same article finds that from February 2020 to February 2024, real hourly earnings rose only 0.9 percent.
These job losses boosted the average hourly earnings of workers remaining on private sector payrolls.
— U.S. Bureau of Labor Statistics, Beyond the Numbers, September 2024
The second strand is about who gained. David Autor, Arindrajit Dube and Annie McGrew found that the tight labor market after the pandemic compressed the US wage distribution, with the fastest growth at the bottom, and that gains went mostly to workers who changed jobs.5
Rapid relative wage growth at the bottom of the distribution reduced the college wage premium.
— Autor, Dube and McGrew, NBER Working Paper 31010
The third strand is about why prices rose. Ben Bernanke and Olivier Blanchard concluded that most of the 2021 to 2022 inflation came from developments that directly raised prices, such as commodity price spikes and shortages, and that the inflation did not originate in labor markets.6 If so, pay may have followed prices, and a lag in pay catching up would be the expected pattern. That is our inference, not theirs.
Our contribution is modest. We rebuild the comparison from raw public series, show how it changes with the pay measure and the start date, and separate components.
Data
Which price and pay series did we use?
We downloaded monthly series as CSV files from FRED (https://fred.stlouisfed.org/series/CPIAUCSL), which republishes data from the US Bureau of Labor Statistics (https://www.bls.gov/cpi/) and the Bureau of Economic Analysis. For prices we used the Consumer Price Index for all urban consumers (CPI-U) and fourteen of its parts: shelter, rent of primary residence, owners equivalent rent, food at home, food away from home, gasoline, medical care, medical care services, used cars and trucks, new vehicles, services, commodities, core (all items less food and energy), and the wage earner version, CPI-W.8 We added the PCE price index, the Fed-watched alternative.9
For pay we used three measures. The first is average hourly earnings of all private employees, a monthly figure from payroll surveys.1 The second is the employment cost index for wages and salaries, a quarterly index from a different survey.3 The third is median usual weekly real earnings of full-time workers, a quarterly measure from household surveys.10 We also used total nonfarm payrolls to date the 2020 job losses.11
A word on what the series are not. They are national aggregates. They do not follow individuals, so a person who changed jobs and got a large raise is averaged with a person whose pay was flat. They also do not say what anyone could afford, because affordability depends on debt, savings, assets and taxes.
How current are the data?
Every monthly CPI and earnings series ends in September 2026, from the releases of 2 and 14 October 2026. The PCE index ends in August 2026. The quarterly series end in the second quarter of 2026. We used the seasonally adjusted versions throughout. The October 2025 CPI is missing from the series, so the 81 calendar months from January 2020 to September 2026 give 80 readings, and 2025 annual averages of the price index use 11 months. Nothing in these series is ours; the choices of base date and measure are.
Method
How did we calculate the gap?
Step one: for each monthly series we took the simple average of the twelve monthly values in 2019 as the base. Step two: we divided the September 2026 value by that base and subtracted one, giving the percent change. Step three: we divided the pay index by the all-items price index to get a real pay index, with the 2019 average equal to 100. Step four: we repeated step three for every month from January 2020, to see how long real pay stayed below 100.
Can the calculation be followed by hand?
Yes. Take average hourly earnings. The twelve monthly values of 2019 average $27.998. The September 2026 value is $37.81. Dividing 37.81 by 27.998 gives 1.3505, so pay rose 35.0 percent. Take all-items CPI-U. The 2019 average is 255.653 and September 2026 is 336.298. Dividing gives 1.3154, so prices rose 31.5 percent.
Real pay is the first ratio divided by the second: 1.3505 divided by 1.3154 is 1.027, so real pay is 2.7 percent higher, and the real pay index is 102.7. For any month we do the same sum with the values for that month. Anyone with a spreadsheet and the two FRED files can reproduce it in a few minutes.
For the gap by component, we subtracted the pay change from each component change, in percentage points. A positive number means the component rose faster than pay.
How did we test the choices?
We changed the start date (2019 average, December 2019, February 2020, January 2021, June 2022) and the end date (September of 2024, 2025 and 2026). We swapped the price index (CPI-U, CPI-W, PCE, core CPI). We swapped the pay measure (average hourly earnings, the employment cost index, median weekly real earnings). For quarterly series we compared the 2019 average of four quarters with the second quarter of 2026, using the average of April to June 2026 for the matching price index.
We then split the period into phases, and computed the year-over-year change in real pay for each month, counting months where it was negative. We recomputed the headline changes with a separate shell script using awk, and got the same eleven figures it covers, including the 30.3 percent for the employment cost index.
Findings
Did prices outrun pay on average?
Not on the headline measure. Average hourly earnings rose 35.0 percent1 from the 2019 average of $27.998 to $37.81, while all-items prices rose 31.5 percent.12 Dividing one by the other gives a real change of 2.7 percent, so the real pay index reads 102.7 in September 2026 (2019 = 100).
That is the result of the plain calculation. The rest of this piece asks how much weight it can bear. We look at which prices drove it, what happens when the start date or the pay measure changes, how the result splits across phases and households, and how it compares with the pace of real pay growth before the pandemic. Each cut is reported, including those that cut against the headline.
Which prices rose faster than pay?
Gasoline rose 62.4 percent8, 27.4 points more than pay. Food away from home rose 40.2 percent, 5.2 points more. The housing measures were just above pay: owners equivalent rent 36.7 percent, rent of primary residence 36.0 and shelter overall 35.8, between 0.8 and 1.7 points above.8
Below pay were food at home at 32.8 percent, used cars and trucks at 30.3, core CPI at 28.8, commodities at 27.7, new vehicles at 22.3, medical care services at 22.2 and medical care overall at 19.1. Of ten detailed components, five rose more than pay and five less. Services, at 33.7 percent, rose less than pay by 1.3 points, and commodities by 7.3.
| Series | Change since 2019 average (%) | Gap versus pay (points) |
|---|---|---|
| Gasoline | 62.4 | 27.4 |
| Food away from home | 40.2 | 5.2 |
| Owners equivalent rent | 36.7 | 1.7 |
| Rent of primary residence | 36.0 | 1.0 |
| Shelter | 35.8 | 0.8 |
| Average hourly earnings (pay) | 35.0 | 0.0 |
| Services (all) | 33.7 | -1.3 |
| Food at home | 32.8 | -2.2 |
| CPI-W all items | 32.7 | -2.4 |
| All items CPI-U | 31.5 | -3.5 |
| Used cars and trucks | 30.3 | -4.7 |
| Core CPI | 28.8 | -6.3 |
| Commodities (all) | 27.7 | -7.3 |
| New vehicles | 22.3 | -12.7 |
| Medical care services | 22.2 | -12.8 |
| Medical care | 19.1 | -15.9 |
How long did real pay stay below its 2019 level?
Only briefly, on this measure. The real pay index peaked at 107.1 in April 2020, fell to its low of 99.7 in June 2022, and was above 100 in 79 of the 80 months from January 2020. The annual averages were 103.6 (2020), 103.2 (2021), 100.7 (2022), 101.0 (2023), 102.0 (2024) and 103.4 (2025, annual average pay divided by annual average prices; the mean of the 11 monthly values is 103.2).
That reading and the experience of households do not match, and the next sections show why.
What is the effect of the 2020 job losses on average hourly earnings?
Between February and April 2020, total nonfarm payrolls fell 14.4 percent, or 21.9 million jobs, and did not return to the February level until June 2022.11 Over the same two months average hourly earnings rose 5.3 percent while prices fell 1.2 percent, so the real pay index jumped 6.6 percent. BLS puts the effect of the lost low-paid jobs at about 5.1 percent in March and April.4 Our figure of 5.3 percent for February to April on today's revised data is close.
This is what researchers call a composition effect. The average rose because the mix of workers changed, not because individual wages jumped. Any comparison that starts in 2019 and ends in 2026 carries part of it as a one-off gain.
- 2020-02Total nonfarm payrolls at 152,293 thousand, the pre-pandemic levelSource 11 (opens the source in a new tab)
- 2020-04Payrolls down to 130,426 thousand; real pay index peaks at 107.1Source 11 (opens the source in a new tab)
- 2021-04First month of falling year-over-year real pay in our data (minus 3.4 percent)Source 1 (opens the source in a new tab)
- 2022-06Real pay index low of 99.7; payrolls back above the February 2020 levelSource 1 (opens the source in a new tab)
- 2023-04End of the longest run of falling real pay, 25 monthsSource 1 (opens the source in a new tab)
- 2026-09Real pay down 0.7 percent from a year earlier; index 102.7Source 1 (opens the source in a new tab)
What happens if we start before the pandemic?
Starting from February 2020, before the job losses, pay rose 32.5 percent to September 2026 and prices 29.7 percent, a real gain of 2.1 percent. To February 2024, the real gain was 0.8 percent, against the 0.9 percent BLS reports.4 Starting from December 2019 gives 2.5 percent. Starting from January 2021, when the price surge was beginning, gives a real change of minus 1.3 percent: pay rose 26.3 percent and prices 28.0.
So the answer depends on where the clock starts. From the 2019 average, pay is ahead. From January 2021, it is slightly behind. From June 2022, when inflation eased, pay rose 17.5 percent and prices 14.0, a real gain of 3.0 percent.
| Start and end | Pay (%) | Prices (%) | Real pay (%) |
|---|---|---|---|
| 2019 average to 2026-09 | 35.0 | 31.5 | 2.7 |
| 2019 average to 2025-09 | 31.1 | 26.8 | 3.4 |
| 2019 average to 2024-09 | 26.2 | 23.1 | 2.5 |
| December 2019 to 2026-09 | 33.2 | 30.0 | 2.5 |
| February 2020 to 2026-09 | 32.5 | 29.7 | 2.1 |
| February 2020 to 2024-02 | 21.0 | 19.9 | 0.8 |
| January 2021 to 2026-09 | 26.3 | 28.0 | -1.3 |
| June 2022 to 2026-09 | 17.5 | 14.0 | 3.0 |
How did pay and prices move in each phase?
After the initial jump, the period splits into four overlapping phases. From April 2020 to June 2021, pay rose 1.7 percent and prices 5.7, so real pay fell 3.8 percent as the early jump unwound. From January 2021 to June 2022, pay rose 7.6 percent and prices 12.3, a real loss of 4.2 percent. From June 2022 to June 2024, pay rose 8.8 and prices 6.1, a real gain of 2.5. From June 2024 to September 2026, pay rose 8.0 and prices 7.4, a gain of 0.5.
The calendar-year picture agrees. Pay grew faster than prices in 2020 (4.9 against 1.3 percent), slightly slower in 2021 (4.3 against 4.7) and much slower in 2022 (5.4 against 8.0). It grew faster again in 2023 (4.5 against 4.1), 2024 (4.0 against 3.0) and 2025 (4.0 against 2.6).
| Phase | Pay (%) | Prices (%) | Real (%) |
|---|---|---|---|
| Feb 2020 to Apr 2020 | 5.3 | -1.2 | 6.6 |
| Apr 2020 to Jun 2021 | 1.7 | 5.7 | -3.8 |
| Jan 2021 to Jun 2022 | 7.6 | 12.3 | -4.2 |
| Jun 2022 to Jun 2024 | 8.8 | 6.1 | 2.5 |
| Jun 2024 to Sep 2026 | 8.0 | 7.4 | 0.5 |
How often did real pay fall year over year?
In 31 of the 80 months from January 2020 to September 2026, real pay was lower than a year earlier. The longest run lasted 25 months, from April 2021 to April 2023, with the lowest reading at minus 3.4 percent in April 2021. In September 2026 the figure was minus 0.7 percent, which matches the Bureau of Labor Statistics real earnings release.12
This is the experience that surveys pick up. Most people compare today with last year, not with 2019, and in that view real pay was falling for two years and is falling again at the end of our data. The headline level comparison and the year-over-year comparison tell different parts of the same story.
Do other pay measures and price indexes agree?
Less than the headline suggests. The employment cost index for wages and salaries rose 30.3 percent from its 2019 average to the second quarter of 2026, while all-items CPI over the same months rose 30.2 percent, a real change of 0.1 percent.3 Median usual weekly real earnings of full-time workers rose 5.4 percent, from 358.75 to 378 in 1982-84 dollars, after peaking at 393 in the second quarter of 2020.10
Changing the price index also matters. Deflating average hourly earnings with CPI-W gives a real gain of 1.8 percent, with core CPI 4.9 percent, and with the PCE price index 6.1 percent to August 2026. The PCE rose less than the CPI, 27.1 percent against 30.7 over the same months to August 2026, which is one reason central bank (https://therealigned.com/story/what-a-central-bank-does) measures of inflation show a gentler picture.7
| Pay measure | Price measure | Real change since 2019 (%) |
|---|---|---|
| Average hourly earnings | CPI-U | 2.7 |
| Average hourly earnings | CPI-W | 1.8 |
| Average hourly earnings | Core CPI | 4.9 |
| Average hourly earnings | PCE price index | 6.1 |
| Employment cost index, wages and salaries | CPI-U | 0.1 |
| Median usual weekly earnings, full-time (real) | CPI-U (built in) | 5.4 |
Why might gasoline and restaurant prices have outpaced pay?
Our data show what rose, not why. The literature offers a frame. Bernanke and Blanchard argue that the 2021 to 2022 surge came mainly from developments that directly raised prices, such as commodity price spikes and sector shortages, rather than from wages.6 Gasoline fits that story in our numbers: the index reached 76.7 percent above its 2019 average in June 2022, a spike far larger than anything in pay.
Food away from home is a different case. It rose 40.2 percent, 5.2 points above pay. One plausible reason is that restaurants are labour-intensive, so their prices follow wages and the cost of ingredients. We did not test that, and the data cannot separate it from other explanations such as higher rents for restaurants or changes in demand.
Is a 2.7 percent real gain a lot or a little?
A level means little without a yardstick. Real pay growth before the pandemic was slow. Using annual averages of average hourly earnings divided by CPI-U, real pay rose 6.5 percent from 2013 to 2019, or 1.05 percent a year, and 0.93 percent a year from 2015 to 2019. From 2019 to 2025 it rose 3.4 percent in total, or 0.55 percent a year.
Measured to September 2026 from the middle of 2019, the pace is 0.37 percent a year over 7.17 years. Had real pay kept growing at the 2013 to 2019 rate until 2025, the real index would have been 106.5 rather than the 103.4 we see. By that yardstick the period was a slowdown, even though the level is above 100.
| Period | Real pay growth per year (%) | Total (%) |
|---|---|---|
| 2013 to 2019 | 1.05 | 6.5 |
| 2015 to 2019 | 0.93 | n/a |
| 2019 to 2025 | 0.55 | 3.4 |
What is behind the latest year?
From September 2025 to September 2026, prices rose 3.7 percent and pay 3.0 percent. That is the minus 0.7 percent in the real earnings release. The price rise is dominated by one item: gasoline rose 34.2 percent in the year. Without it the picture is gentler. Core CPI, which excludes food and energy, rose 2.6 percent, shelter 3.2, food at home 1.8, and medical care 1.5.8
Gasoline has been through a cycle. The index peaked at 409.671 in June 2022, which was 76.7 percent above its 2019 average, and in September 2026 it was 8.1 percent below that peak while still 62.4 percent above 2019. So the current price rise is a second jump from a lower base, on top of the 2022 spike.
| Series | Change Sept 2025 to Sept 2026 (%) |
|---|---|
| Gasoline | 34.2 |
| Commodities (all) | 4.6 |
| All items CPI-U | 3.7 |
| Food away from home | 3.5 |
| Owners equivalent rent | 3.3 |
| Shelter | 3.2 |
| Services (all) | 3.2 |
| Average hourly earnings (pay) | 3.0 |
| Rent of primary residence | 2.8 |
| Core CPI | 2.6 |
| Medical care services | 2.5 |
| Food at home | 1.8 |
| Medical care | 1.5 |
| New vehicles | 0.6 |
| Used cars and trucks | -1.5 |
Does the answer change for different households?
The CPI is one average basket. A real household has its own. As an illustration only, we built four stylised baskets from six of our series, with weights we chose ourselves. They are not BLS expenditure weights and no household looks exactly like them. The sixth component, standing in for everything else, is the all-items index.
- Housing-heavy: 40 percent shelter, 15 food at home, 5 food away from home, 5 gasoline, 5 medical care, 30 all items.
- Car-heavy: 25 shelter, 15 food at home, 5 food away, 20 gasoline, 5 medical care, 30 all items.
- Health-heavy: 25 shelter, 15 food at home, 5 food away, 5 gasoline, 25 medical care, 25 all items.
- Equal weights: one sixth in each of the six series.
The result is a range. With average hourly earnings as pay, the housing-heavy basket gives a real gain of 0.2 percent, the car-heavy basket a loss of 2.7 percent, the health-heavy basket a gain of 2.6 percent, and equal weights a loss of 1.4 percent. The average household in the all-items index gains 2.7 percent. What looks like a settled average is a spread of about five points between stylised households.
| Basket (our weights) | Price change since 2019 (%) | Real pay change (%) |
|---|---|---|
| Housing-heavy | 34.8 | 0.2 |
| Car-heavy | 38.8 | -2.7 |
| Health-heavy | 31.7 | 2.6 |
| Equal weights | 37.0 | -1.4 |
| All-items CPI-U | 31.5 | 2.7 |
Why might the employment cost index and average hourly earnings differ?
Both are published by the Bureau of Labor Statistics, and both cover private employers, but they come from different surveys and answer slightly different questions. Average hourly earnings divides total pay by total hours of everyone on payrolls, so it moves when the mix of jobs, the hours worked or the share of overtime changes. The employment cost index is a separate quarterly survey of employers. The gap between 35.0 and 30.3 percent could reflect job mix, hours, or survey differences. We cannot split it with these series.31
How do the strongest objections hold up?
First objection: average hourly earnings overstate pay because of the composition effect. Partly right, and the sensitivity table shows it. Starting before the job losses trims the real gain from 2.7 to 2.1 percent, and the employment cost index shows almost no gain. But the median earnings series, which also reflects who is employed, shows a gain, so the composition effect does not explain everything.
Second objection: the CPI overstates price rises, because people switch to cheaper goods and quality improves. This is a known argument about price indexes. The PCE, which captures substitution more, rose less. Using it makes pay look better.
Third objection: the CPI understates the rise for people who spend more on what rose fastest. That is true for any individual. A household spending a large share of income on gasoline and restaurant meals sees prices well above the average. A household that spends mostly on medical care and new cars sees less. Our component table gives the range, and the averages hide it.
Fourth objection: pay is not the only income, and prices are not the only cost. Taxes, interest on debt, benefits, hours and savings all matter and are outside these series. Mortgage and rent costs depend on when a household signed, which the shelter index averages out.
What would change our reading?
Three kinds of evidence would sharpen it. The first is microdata that follow the same workers over time, which would remove the composition problem; research of that type, such as the work of Autor, Dube and McGrew, finds that gains were largest for low-wage workers who changed employers.5 The second is price indexes built for particular groups, such as renters, retirees or low-income households, instead of the average urban consumer. The third is the next few months of data, which will show whether the latest year-over-year decline in real pay persists or reverses once the gasoline jump passes through.
Until then, our reading is narrow. On the figures available, pay has kept up with prices in level terms since 2019, with large differences between measures, items and households, and with a recent dip.
What do the findings add up to?
Against our test, the claim that prices outran pay is not supported on the level comparison from the 2019 average, and it is supported for most of 2021 and 2022, and again for the latest year. Pay is ahead of prices on all four combinations that use average hourly earnings, level on the employment cost index, and ahead on median real earnings. Our hypothesis for essentials was half right: shelter and restaurant food rose faster than pay, food at home and medical care did not.
Bernanke and Blanchard describe a surge that did not start in the labor market.6 Our phase table is consistent with that: pay fell behind in 2021 and 2022 and caught up from mid-2022. Autor, Dube and McGrew add that the catch-up was concentrated at the bottom of the wage distribution and among job movers,5 which our national averages cannot show.
Limitations
What could mislead in this comparison?
Average hourly earnings is a mean, not a median, and in spring 2020 many low-paid jobs vanished. That pushed the average up without anyone being paid more, so the early gains and the 2019 comparison are probably overstated. The series also excludes benefits, hours worked and the self-employed, and it covers private employees only.
The price index measures an average basket. A household that drives long distances feels gasoline far more than the headline does, and a renter and an owner experience shelter differently. The shelter index averages leases signed years ago with new ones, so it moves slowly. Seasonal adjustment and later revisions can shift the latest months: the BLS release for September 2026 is preliminary.
The quarterly series cannot be matched exactly to the monthly ones. We compared the 2019 average with the second quarter of 2026 and used the matching months of the price index. We did not control for taxes, interest costs on debt, hours worked, or differences by age, region or industry, so the result describes the national average, not any single household. We also did not test causes. The papers we cite are about why, and we only show what.
Definitions also change. The BLS updates the basket of goods and the weights of the CPI over time, and the way it measures shelter has been debated because it follows rents on existing leases, which respond slowly to market rents. Average hourly earnings is revised with each monthly release and benchmarked once a year. The data we downloaded are the latest vintage, so a reader who looks at the same series next year may see slightly different values.
There is also a risk in our own work. We tried several base dates, end dates and measures. Looking at many cuts and reporting the interesting ones can create patterns that are not there. To limit this, we report every cut we ran, including the ones that go against our hypothesis, and we fixed the main comparison, the 2019 average to the latest month, before we ran the others.
How much of the gap between average hourly earnings and the employment cost index comes from changes in who is employed, and how much from differences in what the two surveys count?
Conflicts
Conflicts of interest
The Realigned has no commercial relationship with the Bureau of Labor Statistics, the Bureau of Economic Analysis, FRED or the Federal Reserve Bank of St. Louis, or the authors we cite. The analysis was done by The Realigned. The question and the main base period were fixed before we looked at the results; the alternative bases and measures were added afterwards and are labelled as sensitivity checks.
Sources
- 1Average Hourly Earnings of All Employees, Total Private (opens the source in a new tab) · FRED, Federal Reserve Bank of St. Louis, 2026 · Dataset · https://fred.stlouisfed.org/series/CES0500000003
- 2Consumer Price Index for All Urban Consumers: All Items in U.S. City Average (opens the source in a new tab) · FRED, Federal Reserve Bank of St. Louis, 2026 · Dataset · https://fred.stlouisfed.org/series/CPIAUCSL
- 3Employment Cost Index: Wages and Salaries: Private Industry Workers (opens the source in a new tab) · FRED, Federal Reserve Bank of St. Louis, 2026 · Dataset · https://fred.stlouisfed.org/series/ECIWAG
- 4Did the COVID-19 pandemic affect real earnings? Analyzing average hourly earnings and inflation before and after the onset of the pandemic (opens the source in a new tab) · Beyond the Numbers, vol. 13, no. 7, 2024 · Report · https://www.bls.gov/opub/btn/volume-13/did-the-pandemic-affect-real-earnings.htm
- 5The Unexpected Compression: Competition at Work in the Low Wage Labor Market (opens the source in a new tab) · National Bureau of Economic Research (Working Paper 31010), 2023 · Paper · https://www.nber.org/papers/w31010
- 6What Caused the U.S. Pandemic-Era Inflation? (opens the source in a new tab) · Hutchins Center, Brookings / PIIE, 2023 · Paper · https://www.brookings.edu/articles/what-caused-the-u-s-pandemic-era-inflation
- 7Personal Consumption Expenditures: Chain-type Price Index (opens the source in a new tab) · FRED, Federal Reserve Bank of St. Louis, 2026 · Dataset · https://fred.stlouisfed.org/series/PCEPI
- 8Consumer Price Index (opens the source in a new tab) · U.S. Bureau of Labor Statistics, 2026 · Primary source · https://www.bls.gov/cpi/
- 9Personal Consumption Expenditures Price Index (opens the source in a new tab) · U.S. Bureau of Economic Analysis, 2026 · Primary source · https://www.bea.gov/data/personal-consumption-expenditures-price-index
- 10Employed full time: Median usual weekly real earnings: Wage and salary workers: 16 years and over (opens the source in a new tab) · FRED, Federal Reserve Bank of St. Louis, 2026 · Dataset · https://fred.stlouisfed.org/series/LES1252881600Q
- 11All Employees, Total Nonfarm (opens the source in a new tab) · FRED, Federal Reserve Bank of St. Louis, 2026 · Dataset · https://fred.stlouisfed.org/series/PAYEMS
- 12Real Earnings News Release, September 2026 (opens the source in a new tab) · U.S. Bureau of Labor Statistics, 2026 · Primary source · https://www.bls.gov/news.release/archives/realer_10142026.htm
Plain-language version
The short version
Since 2019, the average hourly wage in the United States has risen a little faster than the average price of what people buy. That does not mean everyone is better off. Gasoline and restaurant meals cost far more than before, while medical care and new cars rose less than pay. Pay was behind prices through 2021 and 2022 and has been mostly ahead since, but in the latest year it slipped behind again. A broader pay measure shows almost no gain, so the answer depends on which wage you pick.
Key takeaways
- Average pay rose 35.0 percent and prices 31.5 percent between 2019 and September 2026.
- Gasoline rose 62.4 percent while medical care rose 19.1 percent.
- The 2020 job losses lifted the average wage, and the employment cost index shows a real change of only 0.1 percent.
- Real pay fell year over year in 31 of 80 months, and was down 0.7 percent in September 2026.