- Place
- Poland
- Years
- 1989–1999
- Policy
- On January 1, 1990 Poland freed nearly all prices, set the zloty at 9,500 per dollar, cut subsidies, tightened credit and taxed pay rises above a norm, all as one package.
- Outcome
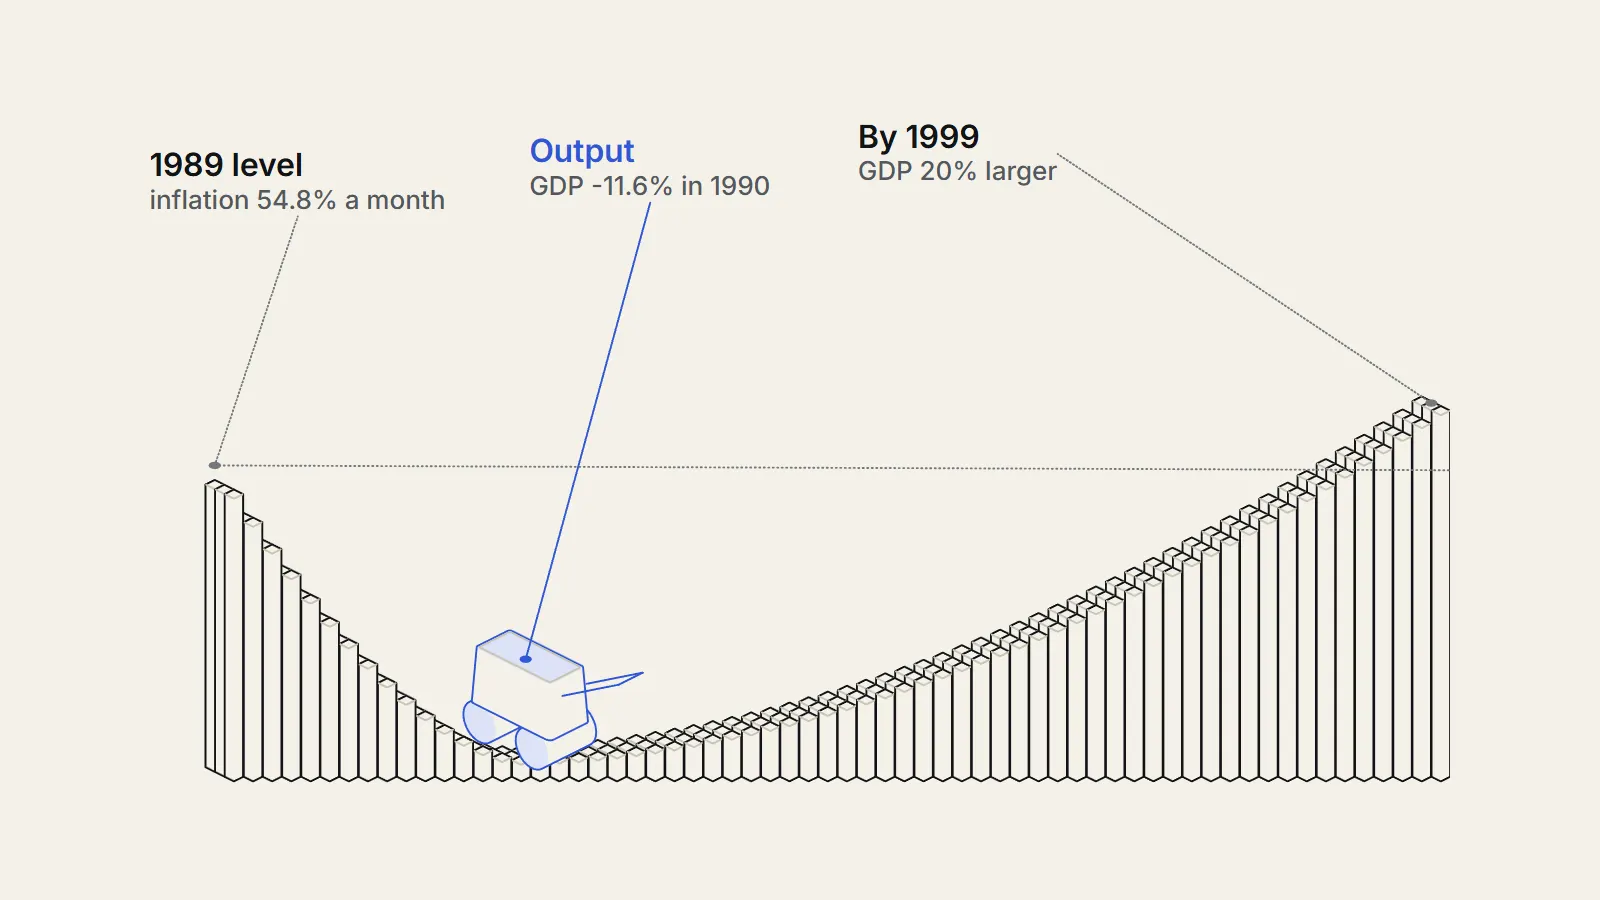
- Monthly inflation fell from 54.8 percent in October 1989 to 4.7 percent in March 1990; GDP fell 11.6 percent in 1990, grew from 1992 and was about 20 percent above 1989 by 1999; registered unemployment passed 16 percent.
The Balcerowicz Plan in Poland was a single package of laws that took effect on January 1, 1990. It freed nearly all prices, set the zloty at 9,500 to the dollar and taxed pay rises above a norm.1 Consumer prices jumped about 80 percent in January, monthly inflation was down to 4.7 percent by March1, and output fell 11.6 percent in 19902 before growth returned in 1992.512 By 1999 GDP was 20 percent larger than in 19894, while registered unemployment, officially zero before, passed 16 percent.43
Before
What was wrong with Poland's economy in 1989?
Poland entered 1990 with three problems at once. Prices were controlled, so shops had queues and black markets sold goods at a multiple of the official price.1 The state was printing money to cover a deficit of about 7 percent of GDP, so the money people held lost value fast.67 And the country owed foreigners $40.3 billion at the end of 1989, with about $3.6 billion of interest due in 1990, more than 40 percent of its export earnings from the West.1
Inflation had been rising for years. Measured consumer price inflation reached 60 percent in 1988 after an austerity attempt was swamped by wage demands.1 In April 1989, after the round-table talks between Solidarity and the government, wage indexation was adopted that guaranteed pay would rise by at least 80 percent of the increase in retail prices.1 That fed the spiral. In October 1989 prices rose 55 percent in a single month6.6
Economists call inflation above 50 percent a month hyperinflation (https://therealigned.com/story/hyperinflation-how-a-currency-collapses), and Jeffrey Sachs, then an adviser to Solidarity, puts the October 1989 figure at 54 percent.7 Table 4 of the Lipton and Sachs paper (https://www.brookings.edu/wp-content/uploads/1990/01/1990a_bpea_lipton_sachs_fischer_kornai.pdf), written in spring 1990, gives the monthly series. We drew it below.
The starting point was not all bad. A private sector of about 28.6 percent of GDP already existed in 1989, mostly small firms and farms.6 But the state sector carried what the Danmarks Nationalbank calls overemployment, of the order of 30 percent of the workforce, kept on for political and social reasons.6 That mattered later: when demand fell, firms had many workers they did not need.
The decision
What did the Balcerowicz Plan in Poland actually do?
Leszek Balcerowicz was Deputy Prime Minister and Finance Minister from September 1989 to December 1991.4 He presented the plan to the Sejm, the lower house of parliament, on 17 December 1989, telling deputies that the Polish economy was "gravely ill" and needed an operation.8 A package of 11 draft laws and regulations followed. Parliament approved them by 27 December under a special procedure and President Jaruzelski signed them into law.8
The authors of Lipton and Sachs (https://www.brookings.edu/wp-content/uploads/1990/01/1990a_bpea_lipton_sachs_fischer_kornai.pdf) summarise the stabilisation as five mutually reinforcing policies.1 We list them with the figures the sources give.
- Budget: subsidies and investment cut sharply to restore balance. The Letter of Intent to the IMF spoke of expenditure cuts of 3 percent of GDP, mainly on food and coal.
- Credit: growth of bank lending tightly controlled, partly through a sharp rise in interest rates.
- Exchange rate: the official rate moved from 6,500 to 9,500 zloty per dollar, the currency was made convertible for trade, and the new rate was held as a price anchor.
- Wages: a tax on pay rises above a norm of no more than 30 percent of January inflation and 20 percent in the next three months, charged at 200 percent on a small excess and 300 to 500 percent on more. This tax, the popiwek, limited the wage bills of state firms.
- Prices: all but about 5 percent of consumer prices and 5 percent of producer prices were freed. Coal prices rose 400 percent for industry and 600 percent for households, and electricity 300 percent.
The package also opened trade: import quotas from the West were scrapped and a uniform tariff of 20 percent was set.1 Outside money made the fixed rate believable. Poland had a $700 million IMF standby arrangement, a $215 million loan from the Bank for International Settlements and a $1 billion stabilisation fund from industrial countries, and the Paris Club of creditor governments agreed in February 1990 to reschedule principal and interest due through March 1991.1
We believe speed is of the essence, so that the transitional stage - so hard on society - will be as short as possible.
— Poland's Letter of Intent to the IMF, 22 December 1989, as reproduced in Nicholas Spiro's 1998 Kent thesis
The letter added that the 1980s had shown the cost of piecemeal reform.8 Balcerowicz himself later said he was influenced by the psychological idea that people adapt more readily to quick, radical changes they believe are irreversible than to gradual ones.8
The market-building half of the programme moved more slowly. A privatisation law passed in July 1990, but only twenty-six large firms had been sold by the end of 1991.5 The plan was a stabilisation and price shock first, and a slow institutional project second.
- 1988Measured consumer price inflation reaches 60 percent after a failed austerity attemptSource 1 (opens the source in a new tab)
- Apr 1989Wage indexation guarantees pay rises of at least 80 percent of retail price risesSource 1 (opens the source in a new tab)
- Oct 1989Prices rise 54.8 percent in the monthSource 1 (opens the source in a new tab)
- Dec 17, 1989Balcerowicz presents the plan to the SejmSource 8 (opens the source in a new tab)
- Dec 22, 1989Letter of Intent signed with the IMFSource 8 (opens the source in a new tab)
- Dec 27, 1989Laws approved by parliament under a special procedure; President Jaruzelski signsSource 8 (opens the source in a new tab)
- Jan 1, 1990Prices freed, zloty set at 9,500 per dollar, wage tax in forceSource 1 (opens the source in a new tab)
- Feb 1990Paris Club agrees to reschedule debt payments due through March 1991Source 1 (opens the source in a new tab)
- Jul 1990Comprehensive privatisation law passedSource 5 (opens the source in a new tab)
- Jan 1991Trade within the CMEA, the Soviet-bloc trading system, collapsesSource 5 (opens the source in a new tab)
- May 1991Zloty devalued 17 percent and a crawling peg introducedSource 2 (opens the source in a new tab)
- 1992GDP growth turns positive (2.6 percent)Source 2 (opens the source in a new tab)
What was the strongest case against the Balcerowicz Plan?
Several of the facts behind that argument are not in dispute. Forecasts used for the programme put GDP growth at -3.5 percent for 1990 and +3.5 percent for 1991, against outcomes first reported as -11.4 and -7.4 percent and later revised to -11.6 and -7.0.2 The CASE report calls this a set of technical errors, mostly in forecasting.2
Andrew Berg and Olivier Blanchard, in a study written in 1992 (https://www.nber.org/system/files/chapters/c6016/c6016.pdf), examined the first fall in output. They found that inventories of finished goods rose in 90 percent of industrial branches in the first quarter of 1990, which points to a collapse in demand and not to a failure of production.5 Profit taxes came in larger than expected because firms were reporting paper profits created by inflation, and the budget showed a surplus of about 2 percent of GDP in the first quarter.5 They then took up the question, raised by Bruno in the same volume, of whether the contraction could have been partly avoided.
With the benefit of hindsight, the answer must be a qualified yes.
— Andrew Berg and Olivier Blanchard, Stabilization and Transition: Poland, 1990-91
They added a caution of their own: guessing demand in January 1990 was hard, and credibility required, if anything, erring on the side of excess.5 The critics and the economists who accept part of the criticism disagree about how much easier a different policy would have been, not about whether errors were made.
Opposition to one instrument, the wage tax, came from opposite directions. Spiro records that free-market liberals such as Stefan Kurowski and Jan Winiecki wanted the popiwek abolished as a visible form of state intervention, while the unions opposed it too.8 The authors of the CASE report (https://www.files.ethz.ch/isn/105299/59.pdf) report that, at a spring 1991 conference at the presidential palace, critics also accused the government of letting the IMF make decisions and of selling state property for pennies.2 The CASE authors judge much of that criticism poorly argued, but they accept that the reformers did too little to explain the programme to the public.2
What happened
What happened to prices, shortages and the budget?
After the Balcerowicz Plan took effect the price level moved at once. The consumer price index rose 80 percent in January 1990, and measured real wages fell 40 percent because nominal wages were held back.5 Sales from industry fell 20 percent that month.5 By April, Lipton and Sachs reported, queues had all but disappeared and meat was freely available in the official shops.1
Monthly inflation, over 70 percent in January, was under 10 percent by the second quarter.2 Annual figures stayed high: the Library of Congress country study puts price increases at 250 percent for 1990 and 70.3 percent for 1991.10 End-year inflation was 249.3 percent in 1990, 60.4 percent in 1991 and 44.3 percent in 1992.2
The state finances improved at first and then slipped. Public finances showed a surplus of 3.2 percent of GDP in 1990, and a deficit of 2.3 percent in 1991 and 5.3 percent in 1992.2 The trade surplus of about 4 percent of GDP in 1990 also turned into a deficit.52 The CASE authors tie the trade swing to the fixed exchange rate and continued high inflation, which produced a real appreciation of the zloty.2
How deep was the fall in output and jobs?
GDP fell 11.6 percent in 1990 and 7.0 percent in 1991, grew 2.6 percent in 1992 and then between 3.8 and 7.0 percent a year until 1998.2 Compounding the first two numbers gives a total fall of about 18 percent, our calculation. The Library of Congress study reports industrial output down 24 percent in 1990 and a further 12 percent in 1991, and real wages down 29.2 percent in 1990, followed by a 2.0 percent rise in 1991.10
Two shocks sat inside that fall. The first was the stabilisation of early 1990. The second came in January 1991, when trade within the CMEA, the Soviet-bloc trading system, broke down.5 Exports had already been turning west: in 1988 exports to developed market economies were 39.7 percent of the total and CMEA exports 42.7 percent, and by 1990 the EU and EFTA took 60.5 percent while Central and Eastern Europe and the former USSR took 23.7 percent.2 The central bank (https://therealigned.com/story/what-a-central-bank-does) raised its refinance rate to 55 percent in December 1990 and 70 percent in January 1991, and the zloty was devalued 17 percent in May 1991.2
Unemployment was the new feature. It had been officially 0 percent under central planning, and it reached over 16 percent in 1993.3 Registered unemployment was 6.5 percent at the end of 1990, 12.2 percent in 1991 and 16.4 percent in 1993, then fell to 10.3 percent in 1997 before rising again.2
Two cautions apply to those job numbers. The Library of Congress study notes that many of those who found private jobs had been registered as unemployed, and that official statistics lagged behind.10 And Myck and Oczkowska cite estimates that formerly inactive people moving onto the register made up over 60 percent of the newly unemployed in 1989 to 1991.3
Who bore the cost, and how long did it last?
The World Bank's study of incomes in transition economies finds that in Poland during 1990 to 1993 almost all the rise in the poverty headcount came from falling real incomes, not from wider inequality, although inequality began adding to poverty from 1992.11 Households with an unemployed member had poverty rates about four times the average, and 30 percent of Polish poverty could be attributed to unemployment.11 Poverty in 1994 was still slightly above its 1992 level even as GDP grew.11
A survey study by Myck and Oczkowska followed people who lost jobs. About 20 years later, those who lost a job in a plant closure during 1989 to 1991 had incomes as much as 30 percent lower3 and were 10 percentage points less likely to own their home. The authors found no evidence of a lasting causal effect on life satisfaction or depression.3 They found no such income gap for jobs lost in 1992 to 1995, which suggests the damage came from the first adjustment years.3
Did Poland recover after the Balcerowicz Plan, and how does that compare?
Sources differ on the date Poland regained its old output. The Danmarks Nationalbank (https://www.nationalbanken.dk/en/publications/Documents/2002/12/2002_MON4_the73.pdf) gives 1996 and says that by 2001 the economy was almost 30 percent larger than in 1989.6 Myck and Oczkowska and the World Bank study give 1995, from a 1987 base in the latter.311 Balcerowicz, writing in 2000, says GDP was 20 percent larger in 1999 than in 1989.4 These differences come from different GDP series and base years. We take them as a range, not as a conflict about direction.
Private firms took over a large part of the economy. Their share of GDP rose from 28.6 percent in 1989 to 70 percent in 2000, in the Danmarks Nationalbank's table.6 Sachs reported that by 1994 about two-thirds of the workforce was in the private sector, with around 2 million private businesses, most of them very small family firms.7
For a comparison we built an index from World Bank constant-price GDP, with 1990 as 100. Poland's series starts in 1990, after the first fall, so the table measures the recovery from the 1990 level and not from 1989. Taking the 1999 index of 138.9 and the 11.6 percent fall in 1990, we calculate about 123 percent of the 1989 level, a little above the 20 percent figure Balcerowicz gives, as expected when two different series are combined.122
| Economy | 1991 | 1993 | 1996 | 1999 |
|---|---|---|---|---|
| Poland | 93.0 | 98.9 | 119.2 | 138.9 |
| Czechia | 88.4 | 88.0 | 100.2 | 100.6 |
| Slovakia | 85.4 | 81.2 | 96.9 | 105.6 |
| Hungary | 88.1 | 84.9 | 88.8 | 97.9 |
| Romania | 87.1 | 80.7 | 92.5 | 85.9 |
| Russia | 95.0 | 74.1 | 59.8 | 61.1 |
| Ukraine | 91.3 | 70.6 | 43.0 | 40.8 |
What economists still disagree on
Did the Balcerowicz Plan in Poland cause the recovery, or only the recession?
Three things are argued over about the Balcerowicz Plan, and they should not be mixed together.
Was the recession bigger than it needed to be? Kolodko and Nuti argue that Poland's success in 1994 to 1997 came from market reforms and from the policy changes after 1993, not from the early shock therapy, and that some of the first shocks were unnecessary or excessive.9 Kolodko's later paper reaches a split verdict: Poland's GDP grew more than any other postsocialist country over two decades, but better policy coordination might have raised growth by more than half, so he rates the transformation a success to the extent of two-thirds of its potential.13 The CASE authors take the other side. They use Kornai's term transformational recession: output had to fall because firms were producing goods that did not match what buyers wanted, and in 1991 GDP fell while consumption rose by 3.3 percent.2 On that reading some of the fall was a correction, not a loss.
Was the fall overstated? There are good reasons to think so. The Library of Congress study says the 1989 baseline was inflated and that firms deliberately understated revenues to avoid taxes.10 The Danmarks Nationalbank adds that pre-transition income levels were probably overrated, that new private firms were poorly covered, and that part of the output decline, such as shutting polluting plants, may even have helped prosperity.6 Sachs makes the same point about jobs: unemployment peaked near 15 percent, but he says household surveys suggested nearer 10.7 Against that, Milanovic compared household surveys with national accounts and found that in most countries with both sources the surveys showed larger income falls.11 Households, in other words, reported worse outcomes than the GDP figures did.
Did shock therapy explain Poland's lead? In the comparison table Poland is further above its 1990 level in 1999 than any economy listed, and Sachs presents this as evidence that radical reformers outperformed gradualists such as Hungary.7 Kornai took a similar line in 1990, writing in his comment on the Lipton and Sachs paper that "the Hungarian experience clearly shows the dangers and negative effects of partial changes" and warning that partial price liberalisation would feed inflation.1 But Poland also differed in ways that had little to do with the 1990 package. The Danmarks Nationalbank lists a private sector of about 30 percent of the economy at the start, foreign creditors who released part of the debt, and a legal system able to enforce contracts.6 It also notes that before the reforms Poland was deemed to be in deep crisis, with considerably greater challenges than its closest neighbours, and that in the Czech Republic the decline in production was smaller but lasted longer.6
- Agreed in the sources: prices were freed on January 1, 1990, shortages ended, monthly inflation fell below 10 percent within months, GDP fell sharply in 1990 and 1991, and Poland returned to growth in 1992.
- Disputed: how much of the output fall was needed, how much was a measurement artefact, and how much of the later growth the 1990 package caused.
- Not known: what Poland would have looked like under a slower plan. Myck and Oczkowska make the point that the reform cannot be lived through again.
The evidence has limits of its own. Lipton and Sachs were advisers to Solidarity and wrote about the reform they had helped design, and Sachs's lecture is a defence of it.17 We read Kolodko's papers through their abstract pages only. The Berg and Blanchard study covers 1990 and 1991, not the recovery. None of the studies we opened compares Poland with a matching country that took a different route, and Myck and Oczkowska say a purely causal verdict is impossible.3
If the same stabilisation had come with larger unemployment benefits, a slower budget squeeze or a softer wage tax, how much of the 1990 to 1991 output fall and the long-term income loss for laid-off workers would have been avoided, and how can anyone measure it?
Lessons
Key takeaways
- The Balcerowicz Plan tried to end hyperinflation and shortages in one move: prices freed, the zloty fixed, credit and wages squeezed, with foreign money behind the exchange rate.
- Inflation fell within months, but output fell about 18 percent over 1990 and 1991, and registered unemployment passed 16 percent by 1993.
- Part of the fall was a correction and part was measurement error, yet Berg and Blanchard and the CASE authors both accept that forecasting mistakes made the contraction larger.
- Poland's later lead rests on a mix of causes: the 1990 package, a private sector already in place, debt relief and the growth of new firms.
What carries over from the Balcerowicz Plan in Poland is the mechanism. When controlled prices, printed money and a weak currency feed each other, a one-time reset of all three can end the spiral quickly, and the cost showed up in output and jobs. What does not carry over automatically is Poland's starting point: a private sector of about 30 percent, outside debt relief and creditor support, and export markets that were already turning west. We did not study other economies' reforms for this piece, so we cannot say how far these conditions explain the results elsewhere.
Sources
- 1Creating a Market Economy in Eastern Europe: The Case of Poland (with comments by Stanley Fischer and Janos Kornai) (opens the source in a new tab) · Brookings Papers on Economic Activity, 1:1990, 1990 · Paper · https://www.brookings.edu/wp-content/uploads/1990/01/1990a_bpea_lipton_sachs_fischer_kornai.pdf
- 2Understanding Reform: The Case of Poland (CASE Reports No. 59) (opens the source in a new tab) · CASE - Center for Social and Economic Research, Warsaw, 2005 · Report · https://www.files.ethz.ch/isn/105299/59.pdf
- 3Shocked by Therapy? Unemployment in the First Years of the Socio-Economic Transition in Poland and its Long-Term Consequences (IZA DP No. 11342) (opens the source in a new tab) · IZA Institute of Labor Economics, 2018 · Paper · https://docs.iza.org/dp11342.pdf
- 4Poland's Transformation (Economies in Transition) (opens the source in a new tab) · International Monetary Fund, Finance & Development, September 2000, 2000 · Primary source · https://www.imf.org/external/pubs/ft/fandd/2000/09/balcerow.htm
- 5Stabilization and Transition: Poland, 1990-91 (opens the source in a new tab) · NBER / University of Chicago Press, The Transition in Eastern Europe, Vol. 1, 1994 · Paper · https://www.nber.org/system/files/chapters/c6016/c6016.pdf
- 6The Economic Situation in Poland (opens the source in a new tab) · Danmarks Nationalbank, Monetary Review 4th quarter 2002, 2002 · Primary source · https://www.nationalbanken.dk/en/publications/Documents/2002/12/2002_MON4_the73.pdf
- 7Shock Therapy in Poland: Perspectives of Five Years (Tanner Lectures on Human Values) (opens the source in a new tab) · The Tanner Lectures on Human Values, University of Utah, 1994 · Essay · https://www.earth.columbia.edu/sitefiles/file/about/director/documents/LecTanner0494.pdf
- 8The politics of economic transition: 'shock therapy' in Poland 1990-1991 (opens the source in a new tab) · University of Kent (PhD thesis), 1998 · Study · https://kar.kent.ac.uk/85980/
- 9The Polish Alternative: Old Myths, Hard Facts and New Strategies in the Successful Transformation of the Polish Economy (UNU-WIDER Research for Action 33) (opens the source in a new tab) · UNU-WIDER, 1997 · Paper · https://ideas.repec.org/p/ags/widerw/295327.html
- 10Poland - Macroeconomic Indicators for 1990-91 (Poland: A Country Study) (opens the source in a new tab) · U.S. Library of Congress Country Studies, 1992 · Primary source · https://countrystudies.us/poland/53.htm
- 11Income, Inequality, and Poverty during the Transition from Planned to Market Economy (opens the source in a new tab) · The World Bank, Regional and Sectoral Studies, 1998 · Report · https://stonecenter.gc.cuny.edu/files/1998/02/milanovic-income-inequality-and-poverty-during-the-transition-from-planned-to-market-economy-1998.pdf
- 12World Development Indicators: GDP (constant 2015 US$), NY.GDP.MKTP.KD, Poland, Czechia, Hungary, Slovakia, Romania, Russia, Ukraine, 1989-2000 (opens the source in a new tab) · World Bank Open Data (series last updated 2026-10-08), 2026 · Dataset · https://api.worldbank.org/v2/country/POL/indicator/NY.GDP.MKTP.KD?format=json&date=1989%3A2000
- 13A Two-thirds Rate of Success: Polish Transformation and Economic Development, 1989-2008 (UNU-WIDER RP2009-14) (opens the source in a new tab) · UNU-WIDER, 2009 · Paper · https://ideas.repec.org/p/unu/wpaper/rp2009-14.html