Summary
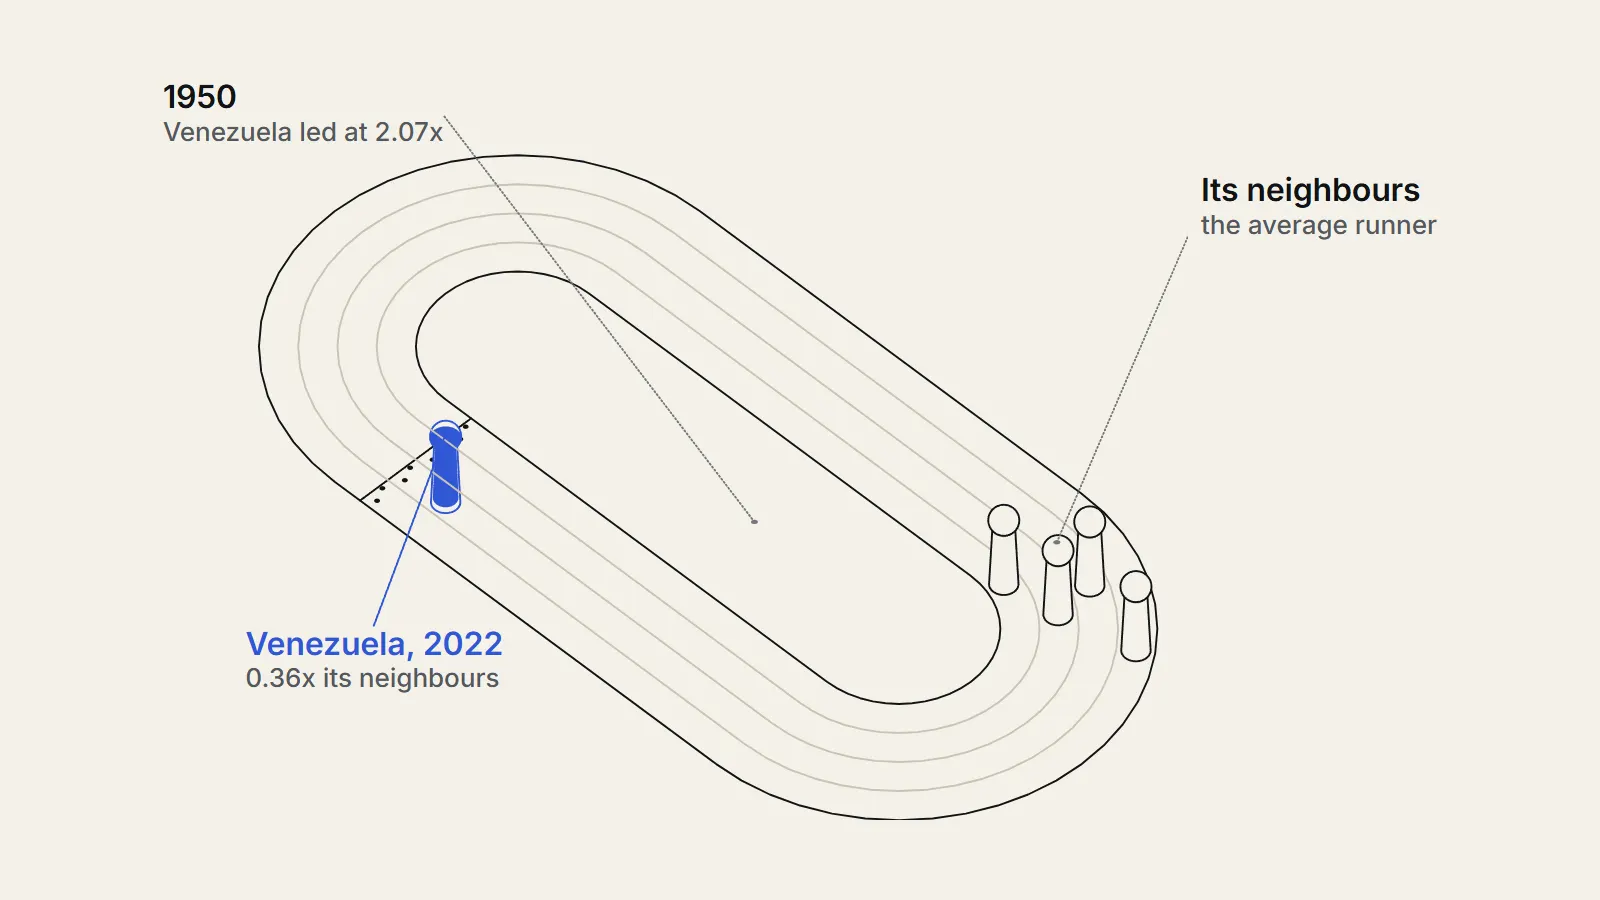
How did Venezuela GDP per capita compare with its neighbours, and when did the lead disappear? We compared Venezuela with eight Latin American economies from 1950 to 2022 in the Maddison Project Database and checked growth against World Bank data. Venezuela's output per person was 2.07 times the neighbours' average in 1950, peaked at 2.65 times in 19641, was still 1.32 times in 2013 and was 0.36 times in 20221. About two thirds of the lost lead went after 2013, when output per person fell 73.2 percent while the neighbours' average fell 7 percent; one third went earlier, gradually. The data fit several explanations and cannot split the fall between oil prices, policy and sanctions.1
The question
What are we asking about Venezuela GDP per capita?
The question: how did Venezuela's GDP per capita, meaning the value of everything the country produces in a year divided by its population, move against its neighbours between 1950 and 2022, and when did any gap open? Venezuela is a hard case to discuss calmly. People with opposed views cite the same curve: some read it as a lesson about state control of the economy, some as a lesson about depending on oil, and some as a lesson about foreign sanctions.
We wrote down the test before building the charts and tables, although we had looked at headline levels while checking that the files downloaded correctly. We would call the claim "Venezuela fell behind its neighbours only after 2013" unsupported if the ratio of its income per person to the neighbours' average was already at least a quarter below its 1960s level by 2013. We would call it supported if the ratio stayed within 10 percent of that level until 2013.
Our hypothesis was in two parts. First, that Venezuela really was far richer than its neighbours around 1950. Second, that the post-2013 collapse accounts for most of the lost lead but not all of it, because earlier studies describe a slower slide from the late 1970s.
What have earlier studies found?
Several research groups have measured the same decline and read it differently. Ricardo Hausmann and Francisco Rodriguez edited a volume arguing that the growth collapse began long before 1999. They note that Venezuela was the richest country in Latin America by 1970, and that between 1978 and 2001 non-oil output fell almost 19 percent and oil output about 65 percent.2 Their chapters look at oil, labour rules, finance, weakening democratic governance and industrial policy.
A 2007 report by Mark Weisbrot and Luis Sandoval of the Center for Economic and Policy Research took a different line on the Chavez years. It found that real GDP per person fell 26 percent from 1978 to 1986 and in 2003 stood 38 percent below its 1978 peak, and that the economy then grew 76 percent from the first quarter of 2003.3 The authors rejected the view that the expansion was only an oil boom headed for a bust, while warning of serious measurement problems before 1984.
There is much evidence to contradict this conventional wisdom.
— Weisbrot and Sandoval, CEPR, July 2007, on the "oil boom headed for a bust" view
Dorothy Kronick and Francisco Rodriguez describe three Venezuelan catastrophes since independence, and put per-person GDP down 71.8 percent in the recession of 2012 to 2020. They split it into a crisis of accumulated imbalances, price controls and an oil price fall from 2012 to 2016 and a second crisis from 2017 driven by falling oil output, which they link in part to financial and oil sanctions.4
Far worse than other countries with similar exports.
— Kronick and Rodriguez, 2023, on Venezuela's three collapses compared with other commodity exporters
On sanctions, Weisbrot and Jeffrey Sachs argue that oil output fell at more than three times its earlier rate after the August 2017 order, and that most of the harm fell on civilians.5 Rodriguez's firm-level study finds that oil firms with access to international credit lost output after sanctions, and that the estimated effects explain around half of the output drop in those firms.6 A cross-country paper by Jeffrey Sachs and Andrew Warner (1995) found that economies with high natural resource exports relative to GDP grew more slowly over 1971 to 1989.7
These studies agree on the shape, a long slide from the late 1970s and a far steeper fall after 2012. They disagree on weights. Our contribution is smaller: we place the shape against neighbours in one dataset, check how robust it is, and say what the numbers cannot settle.
Data
Which data did we use for Venezuela GDP per capita?
The main source is the Maddison Project Database 2023 (https://www.rug.nl/ggdc/historicaldevelopment/maddison/releases/maddison-project-database-2023), compiled by Jutta Bolt and Jan Luiten van Zanden at the University of Groningen. It gives real GDP per person for 169 countries up to 2022, in 2011 US dollars adjusted for purchasing power, and is licensed under Creative Commons Attribution 4.0.1 Purchasing power adjustment means incomes are converted at the price of a common basket of goods, not at market exchange rates. This matters for Venezuela, whose exchange rate has been controlled for long periods.
The database asks users to cite the original papers when the data appear in graphs, so we cite the 2025 paper by Bolt and van Zanden, which explains the benchmarks and the move to a 2011 base.10 The Sources sheet credits Guillermo De Corso's 2013 reconstruction for Venezuela from 1830 to 2012.11 For 2008 to 2022 it says the database uses the Conference Board Total Economy Database where a country is covered, and otherwise United Nations national accounts. We could not tell which applies to Venezuela. Because we analyse fewer than twelve economies, the database also asks that the original papers for each be cited; they are listed on its Sources sheet and we do not reproduce them here.
For the cross-check we used the World Bank's GDP per capita (https://data.worldbank.org/indicator/NY.GDP.PCAP.KD?locations=VE) in constant 2015 US dollars, which runs from 1960 and is licensed CC BY 4.0, plus its population series.812 This series converts at market exchange rates, so it is not on the same footing as the Maddison numbers for comparing levels. The World Bank's purchasing-power series has no Venezuela, so we could not use it. For oil we used monthly West Texas Intermediate spot prices and consumer prices from FRED.913
We call eight economies the neighbours: Colombia and Brazil, which share a land border with Venezuela, and Chile, Peru, Ecuador, Argentina, Mexico and Bolivia. We chose them because the database has a full annual series for each from 1950 to 2022. Guyana, a third land neighbour, is not in the database, so we looked at it separately in the World Bank data. Paraguay, Uruguay and Suriname were not used.
How complete and current are the data?
All nine economies have all 73 annual values from 1950 to 2022 in the Maddison file, so we did not fill or interpolate any year. The World Bank series for Venezuela runs to 2025; the page was last updated on 8 October 2026.
Completeness is not the same as accuracy. Weisbrot and Sachs wrote in 2019 that there had been no official government data for these indicators since 2015, and used outside estimates.5 That means Venezuelan numbers for the years of the steepest fall come from outside estimates rather than from official releases. We return to this under limitations.
Population matters for a per-person measure. The refugee and migrant platform R4V (https://www.r4v.info/en/refugeeandmigrants) reports 6,978,009 Venezuelans abroad in Latin America and the Caribbean, as of August 2026, a sum reported by host governments that likely undercounts people without regular status.14 We check the effect on the denominator in the findings.
Method
How did we calculate the comparison?
Step one: we converted the database's spreadsheet into text files with our own script and read the GDP per person and population of Venezuela and the eight neighbours for each year from 1950 to 2022. Step two: we took the simple, unweighted average of the eight neighbours for each year. Step three: we divided Venezuela's value by that average to get the ratio, and ranked the nine economies from 1 (richest) to 9.
Step four: we computed growth between chosen years as an annual compound rate, which is the end value divided by the start value, raised to the power of one over the number of years, minus one. We cut the period at 1980, 1998, 2013 and 2020 to follow the debt crisis, the election of Hugo Chavez, the death of Chavez and the end of the steepest fall.
Step five: to ask when the lead was lost, we took the natural logarithm of the ratio. A logarithm turns a ratio into an additive quantity, so the fall from the 1964 peak to 2022 can be split across periods and the shares add to 100 percent. Step six: we repeated the main changes with the World Bank series and with the 2020 vintage of the Maddison file.
Step seven, for oil: we averaged the twelve monthly WTI prices in each year, multiplied by the 2022 CPI and divided by that year's CPI to express prices in 2022 dollars, and then correlated the year-to-year change in the log of that price with Venezuela's growth minus the neighbours' average growth, using differences in logarithms.
Can the sums be followed by hand?
Yes. Take 2013. The eight neighbours had GDP per person of 12,633 (Colombia), 15,305 (Brazil), 21,171 (Chile), 11,173 (Peru), 10,761 (Ecuador), 19,822 (Argentina), 15,615 (Mexico) and 5,776 (Bolivia). They add to 112,256, and dividing by eight gives 14,032. Venezuela's value was 18,484, so the ratio is 18,484 divided by 14,032, or 1.317.
For 2022 the neighbours average 14,468 and Venezuela had 5,267, a ratio of 0.364. For growth, Venezuela went from 18,484 in 2013 to 4,953 in 2020. The quotient is 0.268; its seventh root is 0.829, so the compound rate was minus 17.1 percent a year, and the cumulative change was minus 73.2 percent.
We recomputed the headline numbers with a second program written in a different language that reads the original file with a different parser. It returned the same ratios for 1950, 1964, 1980, 1998, 2013, 2020 and 2022 (2.072, 2.645, 2.017, 1.518, 1.317, 0.380, 0.364), the same 73.2 percent fall from 2013 to 2020, the same 46 years ranked first, and the same World Bank change of minus 72.9 percent.
How did we test our own choices?
- We repeated the ratio with only the two land neighbours in the file, with the four Andean economies, with Argentina and Chile only, and with each neighbour removed in turn.
- We weighted the neighbours by population in place of the simple average.
- We compared the 2023 file with the 2020 file to see how much revisions move Venezuela.
- We compared the Maddison series with the World Bank series for growth, level and rank.
- We tested the oil explanation four ways: same-year, one-year lag, non-overlapping five-year windows, and 2014 to 2022 alone.
We report every cut, including those that do not support a simple story.
Findings
What is Venezuela's GDP per capita?
Venezuela's GDP per capita was 5,267 dollars in 2022 in the Maddison Project Database (2011 US dollars at purchasing power), down from 8,462 in 1950 and from a peak of 18,486 in 2012.1 The World Bank series, which converts at market exchange rates, shows a similar fall of 70.3 percent from 2013 to 2022.8
How rich was Venezuela GDP per capita in 1950?
Richer than every one of its neighbours. In 1950 Venezuela's GDP per person was 8,462 dollars, against an average of 4,083 for the eight neighbours1, a ratio of 2.07. Only Argentina came close, at 7,949 (Venezuela was 1.06 times Argentina). Chile stood at 5,880, and Brazil at 2,236, so Venezuela was 3.78 times Brazil.1
The lead then grew. By 1960 Venezuela had 12,116 dollars per person against 4,836, a ratio of 2.51, and the ratio peaked in 1964 at 2.65. For 46 of the 73 years from 1950 to 2022, every year from 1950 through 1995, Venezuela ranked first of the nine.
| Year | Venezuela | Colombia | Brazil | Chile | Peru | Ecuador | Argentina | Mexico | Bolivia | Neighbours mean | Ratio |
|---|---|---|---|---|---|---|---|---|---|---|---|
| 1950 | 8,462 | 3,432 | 2,236 | 5,880 | 3,679 | 2,970 | 7,949 | 3,510 | 3,011 | 4,083 | 2.07 |
| 1960 | 12,116 | 3,980 | 3,398 | 6,781 | 4,733 | 3,649 | 8,861 | 4,723 | 2,560 | 4,836 | 2.51 |
| 1970 | 15,289 | 4,932 | 4,635 | 8,195 | 6,143 | 4,535 | 11,639 | 6,873 | 3,469 | 6,303 | 2.43 |
| 1980 | 16,270 | 6,786 | 8,249 | 9,024 | 6,795 | 6,582 | 13,080 | 9,929 | 4,100 | 8,068 | 2.02 |
| 1990 | 13,251 | 7,693 | 7,842 | 10,203 | 4,795 | 6,221 | 10,254 | 9,699 | 3,502 | 7,526 | 1.76 |
| 2000 | 13,993 | 8,497 | 9,834 | 15,212 | 6,038 | 6,908 | 14,369 | 12,613 | 4,174 | 9,706 | 1.44 |
| 2010 | 17,106 | 11,192 | 14,216 | 18,910 | 9,508 | 9,327 | 18,980 | 14,697 | 5,142 | 12,746 | 1.34 |
| 2013 | 18,484 | 12,633 | 15,305 | 21,171 | 11,173 | 10,761 | 19,822 | 15,615 | 5,776 | 14,032 | 1.32 |
| 2020 | 4,953 | 12,377 | 13,686 | 20,206 | 11,137 | 9,646 | 15,976 | 15,254 | 6,062 | 13,043 | 0.38 |
| 2022 | 5,267 | 14,469 | 14,640 | 22,741 | 12,763 | 10,124 | 18,292 | 16,235 | 6,481 | 14,468 | 0.36 |
When did the lead begin to shrink?
Earlier than most accounts of the collapse suggest. The ratio fell from 2.65 in 1964 to 2.43 in 1970, 2.02 in 1980, 1.76 in 1990, 1.52 in 1998 and 1.32 in 2013. In other words, the ratio had halved by 2013, before the steepest fall began. The 2013 ratio is below the 1960s level by far more than the quarter we set as our test, so the claim that the loss began only after 2013 is not supported.
Rank tells the same story with different numbers. Venezuela was second in 1996, 1997, 2001 and 2002, fourth in 2003 after the oil strike, and third in every other year from 1998 to 2015, behind Chile and Argentina. It first fell below the neighbours' average in 2016, was seventh in 2017 and has been ranked ninth, last of the nine, since 2020.
We then split the total fall in the logarithm of the ratio, from 1964 to 2022, into periods. The 1964 to 1980 period accounts for 14 percent of it, 1980 to 1998 for another 14 percent, 1998 to 2013 for 7 percent and 2013 to 2022 for 65 percent1. So roughly two thirds of the lost lead went after 2013 and a third went before.
How did each period grow?
From 1950 to 1980 Venezuela's GDP per person grew 2.20 percent a year against 2.40 for the neighbours' average, a gap of only 0.19 points. Two neighbours grew much faster, Brazil at 4.45 and Mexico at 3.53, while Bolivia, Chile, Argentina and Peru grew more slowly. Cumulatively, Venezuela gained 92.3 percent, Colombia 97.7, Ecuador 121.6, Mexico 182.9 and Brazil 268.9.
From 1980 to 1998 Venezuela's income per person fell 0.55 percent a year, while the neighbours' average rose 0.85 percent. Venezuela lost 9.4 percent in total, Chile gained 69.1 percent and only Peru, at minus 12.8, did worse. This is the period Hausmann and Rodriguez write about, and it fits their account of a collapse that predates the Chavez presidency.2
From 1998 to 2013 Venezuela grew 1.52 percent a year against 2.60. Between 1998 and 2012 the real price of oil rose 364.8 percent, from about 25.8 to 120.1 dollars a barrel in 2022 prices (123.0 in 2013). Venezuela's income per person rose 25.4 percent in 15 years, while Peru, the fastest of the neighbours, rose 88.5 percent and Brazil 62.5.
| Period | Venezuela (% a year) | Neighbours mean (% a year) | Gap (points) |
|---|---|---|---|
| 1950-1980 | 2.20 | 2.40 | -0.19 |
| 1980-1998 | -0.55 | 0.85 | -1.40 |
| 1998-2013 | 1.52 | 2.60 | -1.08 |
| 2013-2020 | -17.15 | -0.85 | -16.30 |
| 2020-2022 | 3.13 | 5.09 | -1.96 |
| 1950-2013 | 1.25 | 2.00 | -0.75 |
A closer look at the middle of that period supports the report by Weisbrot and Sandoval. Venezuela's income per person fell 20.4 percent from 1998 to 2003 while the neighbours' average rose 1.8 percent. From 2003 to 2012 it rose 57.6 percent against 38.4 percent for the neighbours, and the ratio rose from 1.19 to 1.35.3 The recovery outpaced the neighbours, but from a base depressed by the political crisis and the oil strike of 2002 to 2003, and it did not undo the losses of earlier decades.
How large was the collapse from 2013 to 2020?
It is the largest in the file. Venezuela's income per person fell 73.2 percent from 2013 to 20201, from 18,484 to 4,953 dollars. Its peak was 18,486 in 2012 and its low 4,897 in 2021, a drop of 73.5 percent. The neighbours changed as follows over the same seven years: Colombia minus 2.0 percent, Brazil minus 10.6, Chile minus 4.6, Peru minus 0.3, Ecuador minus 10.4, Argentina minus 19.4, Mexico minus 2.3 and Bolivia plus 5.0.
Kronick and Rodriguez report 71.8 percent for 2012 to 2020 and call it larger than any recession in Latin America since 1950.4 Our 2023-file figure for 2012 to 2020 is 73.2 percent; the small difference may reflect the data vintage they used, which we do not know. By 2022, with a partial rebound to 5,267 dollars, Venezuela was at a level last seen between 1940 (4,769) and 1945 (5,808) in the same series.
The fall was not a single event. The annual change was minus 4.9 percent in 2014, minus 7.1 in 2015, minus 17.8 in 2016, minus 15.4 in 2017, minus 16.9 in 2018, minus 25.2 in 2019 and minus 29.9 in 2020. The share of the whole fall (measured in logarithms, from 2013 to the 2021 low) completed by the end of each year was 4 percent in 2014, 9 percent in 2015, 24 percent in 2016, 37 percent in 2017, 51 percent in 2018, 72 percent in 2019 and 99 percent in 2020. The neighbours' average changed minus 8.9 percent in 2020, the year of the pandemic.
As an illustration of scale, not a forecast: if Venezuela had grown at the neighbours' average rate from 2013, its 2022 value would have been 19,219 dollars, and the actual 5,267 is 27 percent of that. From 1998 the same arithmetic gives 22,516 (actual 23 percent of it) and from 1980, 28,929 (actual 18 percent). These sums say nothing about what any other policy would have produced.
- 1914Venezuelan oil production begins; it becomes macroeconomically significant by the early 1920s.Source 4 (opens the source in a new tab)
- 1950Venezuela's GDP per person is 2.07 times the average of eight neighbours (8,462 dollars).Source 1 (opens the source in a new tab)
- 1964The ratio reaches its peak at 2.65.Source 1 (opens the source in a new tab)
- 1977GDP per person reaches its pre-1990 peak (17,693 dollars in our file); the CEPR report dates the peak in real GDP to the same year.Source 3 (opens the source in a new tab)
- 1998Hugo Chavez is elected president; the ratio is 1.52 and Venezuela ranks third.Source 4 (opens the source in a new tab)
- 2002 to 2003Coup attempt and oil strike; GDP per person is 20.4 percent below 1998 in 2003.CEPR dates the strike to December 2002 to February 2003.Source 3 (opens the source in a new tab)
- 2012GDP per person peaks at 18,486 dollars.Source 1 (opens the source in a new tab)
- March 2013Chavez dies; Nicolas Maduro succeeds him; the oil price begins a sharp fall in 2014.Source 4 (opens the source in a new tab)
- January 2016The oil price falls below 30 dollars a barrel; Venezuelan oil output begins to decline.Source 4 (opens the source in a new tab)
- August 2017The United States imposes financial sanctions; further oil sanctions follow in January 2019.Source 4 (opens the source in a new tab)
- 2021GDP per person reaches its low of 4,897 dollars, 73.5 percent below the 2012 peak.Source 1 (opens the source in a new tab)
Do the World Bank figures agree?
On changes, yes, closely. The World Bank series, which converts at market exchange rates, shows Venezuelan income per person falling 72.9 percent from 2013 to 2020 against our 73.2 percent. It shows minus 70.3 percent to 2022 against minus 71.5. The correlation between the two series' annual growth rates is 0.98 across 62 years, and 0.96 across 496 growth rates for the neighbours.8
We should be careful about what that agreement means. The two series both rest on the same underlying national accounts and estimates, so they are not independent confirmations. They show that the Maddison conversion does not drive the changes. They do not show that the national accounts are right.
On levels, the two disagree sharply. The World Bank series puts Venezuela's income per person at 1.26 times the neighbours' average in 1960 and 0.56 times in 2013, against our 2.51 and 1.32, and ranks it third in 1960 and eighth in 2013 where the Maddison file ranks it first and third. A controlled exchange rate changes the market-rate figure for reasons that have little to do with how much people can buy. So the long decline in relative position is more or less certain in direction, but its size before 2013 depends on how currencies are converted.
| Measure | Maddison 2023 | World Bank |
|---|---|---|
| Change 2013 to 2020 (%) | -73.2 | -72.9 |
| Change 2013 to 2022 (%) | -71.5 | -70.3 |
| Change 1980 to 1998 (%) | -9.4 | -14.1 |
| Change 1998 to 2013 (%) | +25.4 | +16.6 |
| Neighbours mean, 1998 to 2013 (%) | +44.5 | +35.8 |
| Growth 1960 to 2013 (% a year) | 0.80 | 0.25 |
| Ratio to neighbours mean, 2013 | 1.32 | 0.56 |
| Venezuela rank among nine, 2013 | 3 | 8 |
| Correlation of annual growth, 62 years | 0.98 |
Revisions matter as well. In the 2020 vintage of the Maddison file Venezuela's 2013 value was 21,429 dollars; in the 2023 vintage it is 18,484, which is 13.7 percent lower.15 With the earlier vintage the 2013 ratio would be 1.53 rather than 1.32. Years up to 2011 are identical in both files. The size of the pre-collapse lead in 2013 is therefore uncertain by about 0.2 on the ratio, even though the direction is not.
Is the fall an effect of people leaving?
Not mainly. A per-person measure divides by population, so emigration could in principle lower the denominator and soften the fall. In the Maddison file Venezuela's population fell 4.3 percent from 2013 to 2020, total GDP fell 74.3 percent and GDP per person fell 73.2 percent. The World Bank shows the population 7.0 percent lower in 2020 than in 2015.12 On these population series the per-person fall (73.2 percent) is slightly smaller than the fall in total output (74.3 percent). The R4V count of almost seven million departures is far larger than the population falls in these series, so the series may miss many departures; even if all 6,978,009 were missing from the 2020 population, an extreme bound, GDP per person would still have fallen about 64 percent. The people who left are not a random sample.
Does the oil price explain Venezuela GDP per capita relative to its neighbours?
Only weakly in our tests, which is a surprise. Real oil prices were between 24.9 and 31.7 dollars a barrel (2022 prices) in every year from 1951 to 1973, reached 132.8 in 1980, fell to 25.8 in 1998, hit 135.4 in 2008, 120.1 in 2012 and 52.6 in 2016. Between 2012 and 2016 the real price fell 56.2 percent. Between 1980 and 1998 it fell 80.5 percent, while Venezuela's income per person fell only 9.4 percent.
We correlated each year's change in the real oil price with the gap between Venezuela's growth and the neighbours' average growth. For 1951 to 2012 (62 years) the correlation is minus 0.07. With the oil price lagged one year it is 0.33. In twelve non-overlapping five-year windows from 1950 to 2010 it is minus 0.25, and for 2014 to 2022 alone, nine years, it is 0.31. In levels, over 1950 to 2022, the log of the ratio to the neighbours has a correlation of minus 0.44 with the log of the real oil price; this mixes long trends and says little about cause.
In short, same-year oil price changes did not line up with how Venezuela did relative to its neighbours in these tests, although a one-year lag shows a modest positive link (0.33). That does not mean oil is irrelevant. It means the simple year-to-year link is weak, and some neighbours, such as Ecuador and Mexico, also export oil.
Two reading points. A weak correlation does not rule out a large effect that operates through investment, debt or the exchange rate over many years, which an annual test would miss. And the sample is short. The result is consistent with those who say that policy and institutions matter beyond the commodity cycle, and also with the point that the oil price crash after 2012 preceded the steepest fall.4
Does the result depend on which neighbours we choose?
| Comparison set | 1950 | 1980 | 1998 | 2013 | 2022 |
|---|---|---|---|---|---|
| All eight | 2.07 | 2.02 | 1.52 | 1.32 | 0.36 |
| Colombia and Brazil (land borders) | 2.99 | 2.16 | 1.61 | 1.32 | 0.36 |
| Andean: Colombia, Peru, Ecuador, Bolivia | 2.59 | 2.68 | 2.24 | 1.83 | 0.48 |
| Argentina and Chile | 1.22 | 1.47 | 0.97 | 0.90 | 0.26 |
| Population-weighted, eight | 2.31 | 1.85 | 1.43 | 1.22 | 0.35 |
| Leave one out, lowest and highest | 1.22 to 1.42 | 0.34 to 0.40 |
The direction does not change. Against the two land neighbours the ratio is 2.99 in 1950 and 1.32 in 2013. Against the richer southern pair of Argentina and Chile, Venezuela was already below them by 1998 (0.97) and at 0.90 in 2013. Dropping any one neighbour moves the 2013 ratio between 1.22 (without Bolivia) and 1.42 (without Chile), and the 2022 ratio between 0.34 and 0.40.
What does Guyana show?
Guyana, the third land neighbour, is not in the Maddison file, so we used the World Bank series, in constant 2015 dollars at market rates. Venezuela's income per person was 1.58 times Guyana's in 1990 and 0.89 times in 2010. Guyana's rose from 6,279 in 2019 to 39,192 in 2025, and the ratio fell to 0.04. We do not analyse the reasons for Guyana's rise, and the comparison involves a very different, much smaller economy, so we mention it for completeness only.8
What do the competing accounts predict, and what do the numbers show?
There are three broad accounts in the studies we read, and each makes a prediction we can compare with the series. We state each as its authors do.
The first account puts weight on domestic policy and institutions. Hausmann and Rodriguez trace a growth collapse that began before 1999 and examine oil, labour rules, finance, institutions and industrial policy. Kronick and Rodriguez argue that policy decisions made Venezuela perform far worse than other countries with similar exports.24 This view predicts a decline relative to neighbours that began before the 2010s and that is larger than that of other oil exporters. The series show both: the ratio fell in every era from 1964, and against Ecuador, the other oil exporter in the set, the ratio fell from 2.85 in 1950 to 1.72 in 2013 and 0.52 in 2022.
The second account puts weight on oil prices and other external shocks. It predicts that Venezuela's fortunes should move with the real price. Our annual tests find little link, but the 56 percent fall in the real price between 2012 and 2016 coincides with the start of the 2014 to 2016 decline, and an annual test cannot exclude effects that build over years.
The third account puts weight on sanctions. Weisbrot and Sachs argue that the August 2017 order and the January 2019 order sharply cut oil output and imports, and that the damage was large.5 Rodriguez finds that, among oil firms, those with credit access before sanctions lost far more output.6 This view predicts a break in the trend after August 2017 and again in 2019. The annual figures show falls of 17.8 percent in 2016 and 15.4 in 2017, most of it before the broad financial sanctions of August 2017 took effect, and falls of 16.9 in 2018, 25.2 in 2019 and 29.9 in 2020 afterwards. On the logarithmic measure about 37 percent of the fall was complete by the end of 2017 and 63 percent came after; in dollars about 52 percent was complete, so the split depends on the measure.
Kronick and Rodriguez combine the last two, with a 2012 to 2016 crisis from accumulated imbalances and a second from 2017 in which sanctions played a part.4 The annual per-person series cannot attribute shares to causes, because oil output, policy changes, hyperinflation (https://therealigned.com/story/hyperinflation-how-a-currency-collapses), the pandemic and sanctions overlap in time, and the series themselves are estimates for these years.
Limitations
What could mislead in this analysis?
The most important limitation is data quality in the years that matter most. Official Venezuelan statistics were not published for much of the 2015 to 2019 period, and the series for those years in both databases rest on estimates. The Maddison 2020 and 2023 vintages differ by 13.7 percent for 2013 in Venezuela. We report the changes we are most sure about, but the exact levels deserve caution.
Second, converting incomes to a common currency is difficult for a country with exchange controls and very high inflation. Purchasing-power conversions need price surveys, which are hard to run in such conditions. The World Bank's market-rate series puts the relative level much lower than the Maddison series does for the years before 2013, and we cannot say which is closer to lived experience. Both agree on the direction.
Third, GDP per person is an average of production. It does not measure inequality, income after taxes and transfers, shortages, the quality of goods, or health and schooling. A fall in GDP per person of 73 percent need not imply a 73 percent fall in each household's consumption, and the data say nothing about who bore the costs.
Fourth, our neighbours are a choice. The simple average gives equal weight to Bolivia and Brazil. We tested other sets and the direction held, but the size of the ratio moves with the set. Our tests of the oil explanation are crude: they use the American WTI benchmark, not Venezuelan crude, and annual changes, and they cannot detect lagged or structural effects.
Fifth, we tried many cuts of the data, and looking at many cuts can produce patterns by chance. We fixed the ratio and the era split before the others, and report every test we ran. Sixth, nothing here is causal. We describe what happened to a number, not why. We did not test the sanctions explanation directly, and the studies that do rely on oil-firm data we did not have.
How much of the post-2013 fall would have happened with different exchange-rate, price-control and fiscal choices, and how much was due to the oil price and to sanctions, given that all of them overlap in time?
Conflicts
Conflicts of interest
The Realigned has no commercial relationship with the University of Groningen, the World Bank, FRED, the authors of the studies we cite, or any government or party involved in Venezuelan politics. The analysis was done by The Realigned. We state each side's argument as its authors do, and we have not tried to reach a verdict on blame.
Sources
- 1Maddison Project Database 2023 (opens the source in a new tab) · Groningen Growth and Development Centre, University of Groningen, 2024 · Dataset · https://www.rug.nl/ggdc/historicaldevelopment/maddison/releases/maddison-project-database-2023
- 2Venezuela Before Chavez: Anatomy of an Economic Collapse (opens the source in a new tab) · Pennsylvania State University Press, 2013 · Book · https://www.psupress.org/books/titles/978-0-271-05631-9.html
- 3The Venezuelan Economy in the Chavez Years (opens the source in a new tab) · Center for Economic and Policy Research, 2007 · Report · https://cepr.net/documents/publications/venezuela_2007_07.pdf
- 4Political Conflict and Economic Growth in Post-Independence Venezuela (opens the source in a new tab) · arXiv econ.GN 2305.14698, 2023 · Paper · https://arxiv.org/abs/2305.14698
- 5Economic Sanctions as Collective Punishment: The Case of Venezuela (opens the source in a new tab) · Center for Economic and Policy Research, 2019 · Report · https://cepr.net/images/stories/reports/venezuela-sanctions-2019-04.pdf
- 6Sanctions and Oil Production: Evidence from Venezuela's Orinoco Basin (opens the source in a new tab) · Latin American Economic Review 31, article 6, 2022 · Paper · https://doi.org/10.47872/laer.v31.33
- 7Natural Resource Abundance and Economic Growth (opens the source in a new tab) · NBER Working Paper 5398, 1995 · Paper · https://www.nber.org/papers/w5398
- 8GDP per capita (constant 2015 US$), NY.GDP.PCAP.KD (opens the source in a new tab) · World Bank Open Data, 2026 · Dataset · https://data.worldbank.org/indicator/NY.GDP.PCAP.KD?locations=VE
- 9Spot Crude Oil Price: West Texas Intermediate (WTI), WTISPLC (opens the source in a new tab) · FRED, Federal Reserve Bank of St. Louis, 2026 · Dataset · https://fred.stlouisfed.org/series/WTISPLC
- 10Maddison-style estimates of the evolution of the world economy: A new 2023 update (opens the source in a new tab) · Journal of Economic Surveys 39(2), 631-671, 2025 · Paper · https://doi.org/10.1111/joes.12618
- 11El crecimiento economico de Venezuela, desde la oligarquia conservadora hasta la revolucion bolivariana: 1830-2012 (opens the source in a new tab) · Revista de Historia Economica / Journal of Iberian and Latin American Economic History 31(3), 321-357, 2013 · Paper · https://doi.org/10.1017/s0212610913000190
- 12Population, total, SP.POP.TOTL (opens the source in a new tab) · World Bank Open Data, 2026 · Dataset · https://api.worldbank.org/v2/country/VEN/indicator/SP.POP.TOTL?format=json
- 13Consumer Price Index for All Urban Consumers: All Items in U.S. City Average (opens the source in a new tab) · FRED, Federal Reserve Bank of St. Louis, 2026 · Dataset · https://fred.stlouisfed.org/series/CPIAUCSL
- 14Refugees and Migrants from Venezuela (opens the source in a new tab) · R4V, UNHCR and IOM, 2026 · Primary source · https://www.r4v.info/en/refugeeandmigrants
- 15Maddison Project Database 2020 (data file mpd2020.xlsx) (opens the source in a new tab) · Groningen Growth and Development Centre, University of Groningen, 2020 · Dataset · https://www.rug.nl/ggdc/historicaldevelopment/maddison/data/mpd2020.xlsx
Plain-language version
The short version
In 1950 Venezuela was the richest of the nine Latin American countries we compared, with about twice the income per person of its neighbours. That lead faded slowly from the 1960s to 2013. Then, between 2013 and 2020, income per person fell by almost three quarters, while the neighbours' average fell about 7 percent, and Venezuela ended up the poorest of the nine. Researchers disagree about how much to blame government policy, the oil price and foreign sanctions, and the numbers alone cannot divide the blame. They also come from a period when official statistics were scarce, so the exact levels are uncertain even though the direction is not.
Key takeaways
- Venezuela's GDP per person was 2.07 times the neighbours' average in 1950 and 0.36 times in 2022.
- About two thirds of the lost lead went after 2013 (65 percent), and a third before.
- Income per person fell 73.2 percent from 2013 to 2020; the World Bank shows 72.9 percent.
- Oil prices explained little of the year-to-year gap in our tests, and the data cannot separate policy from sanctions.