Summary
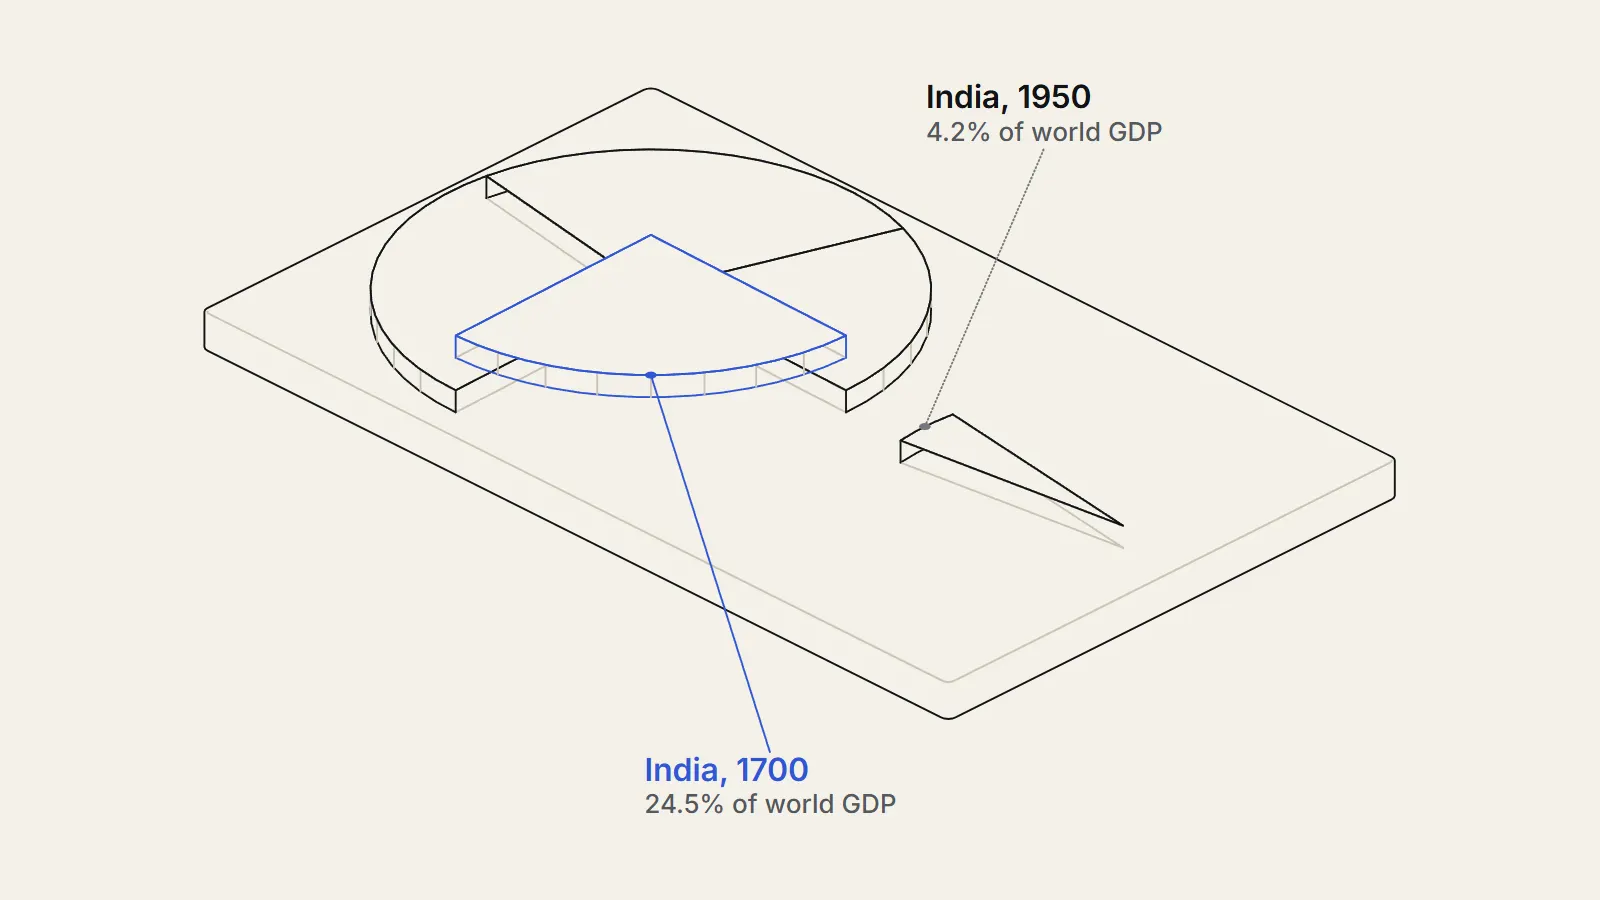
What was India's share of world GDP history from 1700 to 1950, and how firm are the numbers? We rebuilt the share from Angus Maddison's original data and from the newer Maddison Project Database. In Maddison's data India produced 24.5 percent of world output in 17001, 16.1 percent in 1820, 12.2 in 1870 and 4.2 percent in 1950, or 5.1 percent if Pakistan and Bangladesh are counted in1. The newer database gives similar shares after 1820 but a falling income per person before 1870 where Maddison has a flat one. The level in 1700, the cause of the fall and the effect of partition are all disputed.1
The question
What are we asking about India's share of world GDP history?
The question: how large was India's share of world output between 1700 and 1950, how did it change, and how much do the competing estimates disagree? A share of world GDP is India's total production divided by the total production of the whole world in the same year, so it falls whenever the rest of the world grows faster, even if India's own output rises.
The topic is politically charged. One reading says India's fall from about a quarter of world output to a few percent measures what colonial rule took. Another says the decline began before British rule, or reflects the rest of the world growing, or that colonial rule brought gains as well as losses. Both readings often quote the same two numbers, which resemble one economic historian's estimates. We keep to the economics: what the numbers are, how firm they are, and what they can and cannot show.
We set the test after looking at the benchmark rows when checking the files, and before computing the shares. We would call the popular claim "about a quarter in 1700, under 5 percent in 1950" supported if the published estimates put India between 22 and 27 percent in 1700 and below 6 percent in 1950, with the same range across versions. We would call it unsupported for any period where versions differ by more than 3 percentage points.
Our hypothesis was that the figures would reproduce in Maddison's data, that the 1700 figure would turn out to be much less firm than the 1950 figure, and that the 1950 figure would depend on how the border changes of 1947 are handled.
What have earlier studies found?
Angus Maddison built the best-known estimates. In his own table, India had 16.0 percent of world GDP in 1820, 4.2 percent in 1950 and 3.1 percent in 1973, and he wrote that nationalist politicians in colonised countries, including India, rightly considered colonial policy a major barrier to their economic performance.2
A major barrier to their economic performance.
— Angus Maddison, on colonial policy as seen by nationalist politicians, 2008 conference paper
Stephen Broadberry, Johann Custodis and Bishnupriya Gupta rebuilt Indian GDP for 1600 to 1871 from the output side. They found that Indian income per person declined steadily in the seventeenth and eighteenth centuries before levelling off, from over 60 percent of the British level in 1600 to under 15 percent by 1871.3 Their series is the one the Maddison Project now uses for India before 1870.4
These estimates place the origins of the Great Divergence firmly in the early modern period.
— Broadberry, Custodis and Gupta, Explorations in Economic History, 2015
David Clingingsmith and Jeffrey Williamson looked at manufacturing. Retelling Paul Bairoch's survey, they report India with about 25 percent of world industrial output in 1750 and 2 percent in 1900, and they find that much of the fall came before British factories flooded world markets, which they link to the decline of the Mughal state and to drought as well as to British industrial ascent.56 Bishnupriya Gupta places the start of the decline in the middle of the seventeenth century, before colonisation, and says the fate of the textile industry cannot account for the eighteenth-century decline.7
On the colonial question itself, Tirthankar Roy argues that British rule brought some improvements, including an eventual rise in life expectancy and more wealth for business and industry, while an underfunded government was too small to bring general improvements and many poor people suffered.8 Utsa Patnaik, as reported by Jason Hickel, estimates a total drain from India to Britain of nearly 45 trillion dollars for 1765 to 1938, found by calculating the extraction in four periods and compounding each at about 5 percent a year to the present.9 Shashi Tharoor used a share of 23 percent falling to below 4 percent in a 2015 speech, and John MacKenzie replied that Britain was only partly responsible for India's economic decline.10
The studies differ on what drove the decline, and on how much of it is a loss of India's own income as opposed to growth elsewhere. Our contribution is limited to the first layer: the numbers themselves, and how far they hold when the sources and the border assumptions change.
Data
Which data did we use for the history of India's share of world GDP?
We used two families of estimates. The first is the Maddison database of 2010 (https://www.rug.nl/ggdc/historicaldevelopment/maddison/releases/maddison-database-2010), the final version provided by Angus Maddison before his death, with GDP levels in million 1990 international dollars (Geary-Khamis), population in thousands and a World Total row, for 1 AD to 2008.1 The contents sheet says Copyright Angus Maddison and the release page gives no licence, so we only quote the figures we computed.
The second is the Maddison Project Database 2023 (https://www.rug.nl/ggdc/historicaldevelopment/maddison/releases/maddison-project-database-2023), maintained by Jutta Bolt and Jan Luiten van Zanden, with GDP per person in 2011 dollars and population by country, licensed CC BY 4.0.4 We also read the 2020 file and the 2018 release (https://www.rug.nl/ggdc/historicaldevelopment/maddison/releases/maddison-project-database-2018) to see how the estimates for India moved between versions.1211 The database asks users to cite the original papers when data appear in graphs, so we cite the 2025 paper explaining it.13
The Sources sheet of the 2023 file credits Broadberry, Custodis and Gupta (2015) for India from 1600 to 1870.3 The list of sources behind Maddison's original data credits Heston (1983) for India 1870 to 1900, Maddison (1985) for 1900 to 1946 and Maddison (1971) for 1946 to 1950, so the older series for the nineteenth and twentieth centuries rests on a few earlier studies.
The Project Database does not give a world total for years before 1820. For 1820 to 1950 its Regional data sheet gives world GDP per person and world population at seven benchmark years, and we multiplied the two to get world GDP. We assumed that the figure for 1821 was close enough to 1820 for India, because the 2023 file has no India value for 1820 itself.
What is "India" in these data?
This matters more than it looks. Before 1947 the figures for India cover the whole subcontinent under British rule, including what became Pakistan and Bangladesh. After partition they cover the new India only. In Maddison's file India's population drops from 415.2 million in 1946 to 346.0 million in 1947, and the 2023 file shows the same break. The 1950 share of 4.2 percent therefore refers to a smaller territory than the 1913 share of 7.5 percent. Maddison lists Pakistan and Bangladesh separately for 1950, and we use those rows to put the territory back.
The world totals are also less secure than the India figures, especially before 1870. The Project Database builds its world figure from "all GDP pc and population estimates available", as its regional sheet puts it, and Bolt and van Zanden say that reliable comparative data for Africa remain scarce in the nineteenth century.13
Method
How did we calculate the share?
Step one: we converted each spreadsheet into text with our own script. Step two: for Maddison's file, we divided India's GDP by the World Total GDP in the same benchmark year. Step three: we repeated this for population, and for GDP per person, so that we could write the share as the product of two things: India's share of world population and India's income per person relative to the world average.
Step four: we took the natural logarithm of each share. The log of a product is the sum of the logs, so the change in the log of the share between two years splits exactly into a population part and a relative-income part. Step five: for the Project Database we multiplied India's income per person by its population to get GDP, and divided by world GDP per person times world population.
Step six: we put Pakistan and Bangladesh back by adding their 1950 GDP to India's. Step seven: we compared India's income per person with Britain's in each source, and ran a sensitivity test in which India's 1700 income per person is scaled up or down while the rest of the world stays fixed.
Can the sums be followed by hand?
Yes. In Maddison's file India's 1700 GDP is 90,750 million dollars and the world total is 371,058. Dividing gives 0.2446, or 24.5 percent. For 1950 India has 222,222 against 5,335,860, which is 4.16 percent. Adding Pakistan (25,366) and Bangladesh (24,628) gives 272,216, and 272,216 divided by 5,335,860 is 5.10 percent.
For the Project Database, India in 1870 has 850 dollars per person and 253,000 thousand people, so its GDP is 215,050,000 thousand dollars. The regional sheet gives world GDP per person of 1,543.2 dollars and a world population of 1,272,038 thousand, so world GDP is about 1,963,043,000 thousand. The quotient is 10.95 percent.
We recomputed the main numbers with a second program in a different language that parses the spreadsheets separately. It returned the same shares for 1500 to 1950 (24.36, 22.41, 24.46, 16.07, 12.15, 7.47, 4.16), the same undivided 1950 share of 5.10 and the same Project Database shares of 14.44, 10.95, 7.75, 6.41, 5.53 and 4.19 percent.
How did we test our choices?
- We compared three vintages of the Project Database (2018, 2020, 2023) with each other and with Maddison's original file.
- We repeated the 1950 share with and without Pakistan and Bangladesh, in both families of data.
- We compared India's income with Britain's, a ratio that does not depend on the world total.
- We scaled India's 1700 income by factors from 0.6 to 1.5 to see how the share responds.
- We built a hybrid that takes Maddison's world and British figures but India's position relative to Britain from the Project Database.
We report all of these, including those that put the numbers in a different place from the popular ones.
Findings
What was India's GDP in 1700, and what share of the world economy was it?
India was among the three largest economies or regions at every benchmark year from year 1 to 1870, and its share fell in every benchmark interval after 1700. In Maddison's data, India produced 24.5 percent of world GDP in 1700, 16.1 percent in 1820, 12.2 percent in 1870, 7.5 percent in 1913 and 4.2 percent in 1950.1
Earlier it was higher still: 32.0 percent in year 1, 27.8 in 1000, 24.4 in 1500 and 22.4 in 1600. The 1600 to 1700 rise is partly the fall of China in Maddison's series. China had 29.0 percent in 1600, 22.3 in 1700, 33.0 in 1820, 17.1 in 1870, 8.8 in 1913 and 4.6 in 1950. In 1700 India (24.5) was marginally ahead of both China (22.3) and Western Europe (21.8), and by 1870 Western Europe had 33.0 percent and the United States 8.9. By 1950 the United States had 27.3 percent and Western Europe 26.2.
| Year | India GDP (million 1990 dollars) | World GDP | India share (%) | India share of world population (%) | India income per person (1990 dollars) | World income per person (1990 dollars) |
|---|---|---|---|---|---|---|
| 1 | 33,750 | 105,402 | 32.0 | 33.2 | 450 | 467 |
| 1000 | 33,750 | 121,208 | 27.8 | 28.1 | 450 | 453 |
| 1500 | 60,500 | 248,321 | 24.4 | 25.1 | 550 | 566 |
| 1600 | 74,250 | 331,344 | 22.4 | 24.3 | 550 | 596 |
| 1700 | 90,750 | 371,058 | 24.5 | 27.3 | 550 | 615 |
| 1820 | 111,417 | 693,502 | 16.1 | 20.1 | 533 | 666 |
| 1870 | 134,882 | 1,109,684 | 12.2 | 19.8 | 533 | 870 |
| 1913 | 204,242 | 2,733,190 | 7.5 | 16.9 | 673 | 1524 |
| 1950 | 222,222 | 5,335,860 | 4.2 | 14.2 | 619 | 2111 |
Maddison's population figures show why the 1700 share is not a statement of wealth. India had 27.3 percent of the world's people in 1700 and 24.5 percent of its output, so its income per person was about 89 percent of the world average. The same ratio was 80 percent in 1820, 61 percent in 1870, 44 percent in 1913 and 29 percent in 1950.
That distinction matters when the share is quoted as a measure of how rich India was. A country with a quarter of the world's people and a quarter of its output is not richer than average; it is large. In Maddison's file the world average income in 1700 was 615 dollars, India's 550, and both were not far above the 400 dollar level that Broadberry and colleagues describe as bare-bones subsistence.3 A share of output in 1700 therefore mostly records how many people there were. This is a reason to treat the 24.5 percent as a statement about size, and the later fall as a statement about the unequal speed of growth.
Was it a fall in India's output or faster growth elsewhere?
In Maddison's data it is mainly faster growth elsewhere. India's GDP rose 22.8 percent from 1700 to 1820, 21.1 percent from 1820 to 1870, 51.4 percent from 1870 to 1913 and 8.8 percent from 1913 to 1950; the last figure compares an undivided India with a smaller one. World GDP rose 86.9, 60.0, 146.3 and 95.2 percent over the same intervals. From 1700 to 1950 India's GDP rose 144.9 percent (200.0 on an undivided basis) while the world's rose 1,338 percent.
The log split makes the point exactly. From 1700 to 1820, 74 percent of the fall in India's share was due to its falling share of world population1, and only 26 percent to lower relative income. From 1820 to 1870 the shares reverse: 4 percent population and 96 percent income. For 1870 to 1913 and 1913 to 1950 the population part is 32 and 30 percent. Over the whole 250 years, 37 percent of the log fall comes from the population share and 63 percent from relative income.1
What the split cannot do is say why relative income fell. In Maddison's numbers India's income per person is nearly flat at 550 dollars from 1500 to 1700, 533 in 1820 and 1870, 673 in 1913 and 619 in 1950. The flatness is itself a sign of estimation: the same 550 dollars is repeated for 1500, 1600 and 1700, which reads as an assumption and not as an annual measurement, and the newer data challenge exactly that.
What changes with the border in 1947?
The 1950 figure is where the border matters. Maddison's India for 1950 is the post-partition country with 359.0 million people. Adding Pakistan (39.4 million) and Bangladesh (45.6 million), the undivided region had 444.1 million people and GDP of 272,216 million dollars. On that basis the 1950 share is 5.10 percent, not 4.161, and the population share is 17.6 percent against 14.2.1
The Project Database gives the same answer: 4.19 percent for India alone in 1950 and 5.13 percent with Pakistan and Bangladesh. So the popular fall to "below 4 percent" by the time of independence mixes a real decline with a change of territory of about one percentage point. It does not change the broad picture, since 5.1 percent is still about one fifth of the 1700 share.
| Measure, 1950 | India alone | With Pakistan and Bangladesh |
|---|---|---|
| Maddison 2010: share of world GDP (%) | 4.16 | 5.10 |
| Maddison 2010: share of world population (%) | 14.20 | 17.57 |
| Maddison 2010: income per person (1990 dollars) | 619 | 613 |
| Project Database 2023: share of world GDP (%) | 4.19 | 5.13 |
What do the newer estimates say about income per person?
Here the two families diverge. Maddison's India has the same income per person in 1870 as in 1820, and only 3.1 percent less than in 1700. The Project Database, using Broadberry and colleagues for 1600 to 1870, has India at 1,264 dollars in 1600, 1,162 in 1700, 1,068 in 1750, 947 in 1850 and 850 in 1870, in 2011 dollars. That is a fall of 32.8 percent from 1600 to 1870 and 26.9 percent from 1700 to 18704.4
After 1870 the two families agree closely. Both show income per person rising about 26 percent from 1870 to 1913 (26.1 and 26.2) and falling 8.0 percent from 1913 to 1950; the post-1870 path is not where the disagreement lies. The disagreement is about the eighteenth century and before, and about the level of 1870 from which the earlier years are projected. Broadberry and colleagues fix their series at 1871 using an India to Britain ratio for 1871 from Broadberry and Gupta (2010), then work backwards with output data, and conclude that India was richer than Maddison thought in 1600 and fell to Maddison's 1871 level.3
The Project Database itself has moved. In the 2018 release, India's income per person in 1950 was 1,417 dollars (its multiple-benchmark series) against 878 in 1870, a rise of 61.4 percent. In the 2020 and 2023 releases the 1950 value is 987, which is 30.3 percent lower, and the rise from 1870 is 16.1 percent, exactly the 16.1 percent in Maddison's file. The 2018 version also has a second series, using only the 2011 benchmark, that puts India at 970 dollars in 1700 and 710 in 1870.11 We did not trace the reasons for each revision, which the authors discuss in their papers.
| India GDP per person | Maddison 2010 (1990 dollars) | Project Database 2018 (2011 dollars) | Project Database 2020 and 2023 (2011 dollars) |
|---|---|---|---|
| 1600 | 550 | 1,305 | 1,264 |
| 1700 | 550 | 1,200 | 1,162 |
| 1750 | not given | 1,103 | 1,068 |
| 1870 | 533 | 878 | 850 |
| 1913 | 673 | 1,340 | 1,073 |
| 1950 | 619 | 1,417 | 987 |
Do the newer data change India's share of world GDP?
Not by much after 1820. With the 2023 file, India's share of world output is 16.7 percent in 1820, 14.4 in 1850, 11.0 in 1870, 7.8 in 1900, 6.4 in 1920, 5.5 in 1940 and 4.2 in 1950. With the 2020 file the values are 17.3, 15.4, 11.3, 8.0, 7.2, 6.0 and 4.2. Maddison's file has 16.1, 12.2, 8.6, 5.9 and 4.2 for 1820, 1870, 1900, 1940 and 1950. The three sets are within about 1.2 points of each other in every year they share.
| Year | Maddison 2010 | Project Database 2020 | Project Database 2023 |
|---|---|---|---|
| 1820 | 16.1 | 17.3 | 16.7 |
| 1850 | not given | 15.4 | 14.4 |
| 1870 | 12.2 | 11.3 | 11.0 |
| 1900 | 8.6 | 8.0 | 7.8 |
| 1920 | not given | 7.2 | 6.4 |
| 1940 | 5.9 | 6.0 | 5.5 |
| 1950 | 4.2 | 4.2 | 4.2 |
What was India's GDP in 1940?
India's share of world GDP in 1940 was 5.9 percent in Maddison's 2010 file, 6.0 percent in the 2020 Project Database and 5.5 percent in the 2023 one, against 4.2 percent in 1950.1124
A likely reason is that the share depends on India's income relative to the world average, and both the newer India figures and the world averages moved in the same direction. The ratio of India's income per person to the world average in the 2023 file is 0.73 in 1850, 0.55 in 1870, 0.42 in 1900 and 0.29 in 1950; in Maddison's file it is 0.61 in 1870 and 0.29 in 1950.
The 1700 share is different. The Project Database has no world total before 1820, so we cannot rebuild it. As an upper bound, the 17 countries with data in 1700 hold about 413 million of the roughly 603 million people in Maddison's world, and India's share of their combined output is 33.8 percent. That is above Maddison's 24.5 percent because countries with no data are left out of the denominator.
How big is India's gap with Britain in each source?
Comparing India with Britain avoids the world total altogether. In the 2023 file, India's income per person was 74.7 percent of Britain's in 1600, 48.2 percent in 1700, 28.3 in 1821, 14.6 in 1870, 13.1 in 1913 and 8.9 in 1950. Maddison's file gives 56.5, 44.0, 31.2, 16.7, 13.7 and 8.9. The two agree to within a few points from 1700 on, and the 1950 ratio is the same.
So the sources agree that India fell far behind Britain, and that most of the gap opened between 1700 and 1870. What they disagree on is whether India got poorer in absolute terms during that time, which is about India's own level, not the gap.
The gap opened mostly because Britain grew. In the 2023 file Great Britain's income per person rose from 2,412 dollars in 1700 to 3,306 in 1820, 5,829 in 1870 and 11,061 in 1950, while India's went from 1,162 to 937, 850 and 987. Bolt and van Zanden conclude from their own and earlier research that Western Europe's income per person was much higher than the rest of the world's by 1820, which suggests its lead predated the Industrial Revolution (https://therealigned.com/story/why-britain-first-industrial-revolution).13 That is consistent with the Broadberry result and with Gupta's timing, and it does not by itself say anything about the effect of rule from London after the middle of the eighteenth century.
How sensitive is the 1700 share to India's income level?
Very sensitive, because the share is proportional to India's income per person divided by the world average. We scaled India's 1700 income by a factor and adjusted the world total accordingly. If India's income per person was 20 percent lower than Maddison's 550 dollars, its share would be 20.6 percent. If it was 20 percent higher the share would be 28.0 percent, and if 30 percent lower, 18.5 percent.
For the hybrid test, we kept Maddison's figures for the rest of the world and for Britain but placed India at the Project Database's ratio to Britain. That gives an Indian share of 26.2 percent in 1700, 14.8 in 1820, 10.8 in 1870, 7.2 in 1913 and 4.2 in 1950. Against Maddison's 24.5, 16.1, 12.2, 7.5 and 4.2, the 1700 share is higher and the later shares are lower, which is the direction one would expect from a larger initial level and a steeper decline. The hybrid is our construction, not a published estimate, and mixes dollar bases.
What happens if we look at manufacturing?
Manufacturing is a different measure and the fall is steeper. Retelling Bairoch, Clingingsmith and Williamson report India with about 25 percent of world industrial output in 1750, under a fifth by 1800, under a tenth by 1860, under 3 percent by 1880 and 2 percent in 1900.5 They stress that the share fell 6.9 percentage points between 1750 and 1830, before factory-led industrialisation took hold in Britain. We did not recompute these numbers, which come from a survey by Bairoch that we read only as retold by them.
- 1600India has 22.4 percent of world GDP in Maddison's data; its income per person is over 60 percent of Britain's in the Broadberry series.Source 1 (opens the source in a new tab)
- 1700India has 24.5 percent of world GDP and 27.3 percent of world population in Maddison's data.Source 1 (opens the source in a new tab)
- 1750About 25 percent of world industrial output, on Bairoch's figures as retold by Clingingsmith and Williamson.Source 5 (opens the source in a new tab)
- 1765Start of the period in Patnaik's estimate of a transfer from India to Britain, which runs to 1938.Source 9 (opens the source in a new tab)
- 1820India has 16.1 percent of world GDP; China has 33.0.Source 1 (opens the source in a new tab)
- 1858Rule passes from the East India Company to the British Crown.Source 9 (opens the source in a new tab)
- 1871Indian income per person is under 15 percent of Britain's in the Broadberry series.Source 3 (opens the source in a new tab)
- 1900India's share of world industrial output is 2 percent on the same Bairoch figures.Source 5 (opens the source in a new tab)
- 1947Partition: India's recorded population falls from 415.2 million in 1946 to 346.0 million, and pre-1947 and post-1947 shares cover different territory.Source 1 (opens the source in a new tab)
- 1950India has 4.2 percent of world GDP (5.1 percent with Pakistan and Bangladesh).Source 1 (opens the source in a new tab)
- May 2015Tharoor's Oxford Union speech cites 23 percent falling to below 4 percent.Source 10 (opens the source in a new tab)
What does each side claim, and what do the numbers show?
One side says the fall in India's share measures colonial extraction. Patnaik's calculation, as Hickel reports it, adds up annual transfers in four phases from 1765 to 1938 and compounds them at about 5 percent a year.9 Maddison's own text sides with the view that colonial policy was a major barrier.2 The GDP data show a large and continuous fall in share, and in the Project Database a fall in income per person before 1870. They contain no figures for fiscal transfers or trade flows, so they cannot confirm or test the size of a drain, nor the compounding rate that turns annual flows into a total.
Another side says the decline began earlier and had other causes. Gupta puts the start of falling living standards in the mid-seventeenth century, before colonisation.7 Clingingsmith and Williamson find that supply-side problems in India, including the breakup of the Mughal state and climate shocks, mattered from about 1700.6 The data fit this timing for the fall in income per person (1,264 in 1600, 1,162 in 1700) and for manufacturing shares (a fall of 6.9 points between 1750 and 1830). But a decline that starts before 1757 does not show what colonial rule did afterwards, because the data have no India-without-Britain counterfactual.
A third side stresses mixed effects. Roy argues that colonial rule brought some improvements, including an eventual rise in life expectancy and gains for business, while an underfunded government could not bring general improvements.8 MacKenzie, as summarised in the account of Tharoor's speech, argued that Britain was only partly responsible for the decline.10 GDP shares cannot test either claim, because they leave out life expectancy and distribution.
On the headline numbers quoted in debate, the data support the rough size but not the precision. Tharoor's "23 percent" sits between Maddison's 22.4 percent for 1600 and 24.5 percent for 1700. "Below 4 percent" at independence is slightly under Maddison's 4.2 percent for India alone in 1950, and well under the 5.1 percent for the pre-partition territory. Which date marks the start of British rule is a matter of definition, and we cannot place a date between benchmark years without interpolating, which we did not do.
Limitations
What could mislead in this analysis?
The main limitation is that nobody observed world output in 1700. Maddison's shares for early benchmark years are built from population estimates and from incomes that stay at round values such as 400, 450, 550 and 600 dollars for centuries, which suggests assumption, so the early shares are as much judgement as measurement. Our sensitivity test shows that a 20 percent change in India's assumed income moves the 1700 share by 3.5 to 4 points.
The newer estimates are better documented for India but not certain. Broadberry and colleagues build Indian GDP from output data, some of it regional and covering only part of the Mughal Empire, and benchmark 1871 on an earlier India to Britain ratio.3 The Project Database has revised India's 1950 income by 30 percent between versions, which shows how much depends on benchmarks. We did not examine why.
The territory problem affects every comparison across 1947. Our correction adds the 1950 GDP of Pakistan and Bangladesh to India, but those two were poorer than the rest, and we did not rebuild earlier years with their separate histories. Currency conversion is another: Maddison used 1990 prices and the Project Database 2011 prices, and relative prices of the same goods changed.
The world totals are a further weak point for every share. The Project Database fills the regional sheet from whatever country estimates exist, and Bolt and van Zanden say the data for Africa in the nineteenth century are scarce.13 If the unknown parts of the world were poorer or richer than the average of the known parts, India's share would change by the same proportion. Our upper-bound check for 1700, which gives India 33.8 percent of the output of the 17 countries with data, shows how much room there is.
Shares of GDP also hide things. They say nothing about distribution, famine, health, schooling or political rights, and ignore what colonial rule did to those outcomes, as well as the transfers claimed by Patnaik. We have not tested whether the Indian GDP was reduced by transfers because we have no data on them.
Finally, we ran several cuts: three vintages, two territorial definitions, a hybrid and a sensitivity scale. Looking at many cuts can produce patterns by chance. We fixed the first comparison, Maddison's benchmark shares, before the others and report all that we ran. The hybrid is our own construction and should be read as an illustration.
How much of the fall in income per person that the Project Database finds before 1870 reflects real losses for Indian households, and how much reflects the way output is built up from regional evidence?
Conflicts
Conflicts of interest
The Realigned has no commercial relationship with the University of Groningen, the authors of the studies we cite, the Economic History Society, or any government or political party in India or Britain. The analysis was done by The Realigned. We describe each side's claim as its authors make it and give no verdict on responsibility for India's economic history.
Sources
- 1Maddison Database 2010: Historical Statistics of the World Economy, 1-2008 AD (md2010_horizontal.xlsx) (opens the source in a new tab) · Groningen Growth and Development Centre, University of Groningen, 2010 · Dataset · https://www.rug.nl/ggdc/historicaldevelopment/maddison/releases/maddison-database-2010
- 2Shares of the Rich and the Rest in the World Economy: Income Divergence between Nations, 1820-2030 (opens the source in a new tab) · University of Warwick conference paper, 2008 · Paper · https://warwick.ac.uk/fac/soc/economics/seminars/seminars/conferences/econchange/programme/maddison.pdf
- 3India and the great divergence: an Anglo-Indian comparison of GDP per capita, 1600-1871 (opens the source in a new tab) · Explorations in Economic History 55, 58-75, 2015 · Paper · https://eprints.lse.ac.uk/56838/
- 4Maddison Project Database 2023 (opens the source in a new tab) · Groningen Growth and Development Centre, University of Groningen, 2024 · Dataset · https://www.rug.nl/ggdc/historicaldevelopment/maddison/releases/maddison-project-database-2023
- 5India's De-Industrialization Under British Rule: New Ideas, New Evidence (opens the source in a new tab) · NBER Working Paper 10586, 2004 · Paper · https://www.nber.org/papers/w10586
- 6Deindustrialization in 18th and 19th century India: Mughal decline, climate shocks and British industrial ascent (opens the source in a new tab) · Explorations in Economic History 45(3), 209-234, 2008 · Paper · https://ideas.repec.org/a/eee/exehis/v45y2008i3p209-234.html
- 7Falling behind and catching up: India's transition from a colonial economy (opens the source in a new tab) · Economic History Society (summary of Economic History Review 72(3), 803-827), 2019 · Paper · https://ehs.org.uk/falling-behind-and-catching-up-indias-transition-from-a-colonial-economy/
- 8How British Rule Changed India's Economy: The Paradox of the Raj (opens the source in a new tab) · Palgrave Macmillan, 2019 · Book · https://link.springer.com/book/10.1007/978-3-030-17708-9
- 9How Britain stole $45 trillion from India (opens the source in a new tab) · Al Jazeera English, 2018 · Reporting · https://www.aljazeera.com/opinions/2018/12/19/how-britain-stole-45-trillion-from-india/
- 10Shashi Tharoor's Oxford Union speech (opens the source in a new tab) · Wikipedia, 2015 · Reporting · https://en.wikipedia.org/wiki/Shashi_Tharoor%27s_Oxford_Union_speech
- 11Maddison Project Database 2018 (Rebasing Maddison: new income comparisons and the shape of long-run economic development) (opens the source in a new tab) · Groningen Growth and Development Centre, University of Groningen, 2018 · Dataset · https://www.rug.nl/ggdc/historicaldevelopment/maddison/releases/maddison-project-database-2018
- 12Maddison Project Database 2020 (data file mpd2020.xlsx) (opens the source in a new tab) · Groningen Growth and Development Centre, University of Groningen, 2020 · Dataset · https://www.rug.nl/ggdc/historicaldevelopment/maddison/data/mpd2020.xlsx
- 13Maddison-style estimates of the evolution of the world economy: A new 2023 update (opens the source in a new tab) · Journal of Economic Surveys 39(2), 631-671, 2025 · Paper · https://doi.org/10.1111/joes.12618
Plain-language version
The short version
Around 1700 India produced roughly a quarter of everything the world made, by the best-known estimates, because it had about the same share of the world's people and incomes close to the average. By 1950 its share was about 4 percent, or 5 percent if the parts that became Pakistan and Bangladesh are included. Most of the fall came because other parts of the world grew much faster, and newer research also finds that Indian incomes per person fell from 1600 to 1870, which the older estimates do not. Historians disagree about how much to blame British rule, earlier Indian history or the pace of industrialisation elsewhere, and the figures alone cannot settle that. The number for 1700 is the least certain.
Key takeaways
- In Maddison's data India had 24.5 percent of world GDP in 1700, 16.1 in 1820 and 4.2 in 1950.
- Adding Pakistan and Bangladesh back raises the 1950 share to 5.1 percent.
- India's own output grew in every interval, so the fall in share reflects faster growth elsewhere.
- The newer database shows income per person falling 26.9 percent from 1700 to 1870, where Maddison shows 3.1 percent.
- The 1700 share is the least certain figure: a 20 percent change in India's income shifts it by about 4 points.