- Place
- China
- Years
- 1978–2019
- Policy
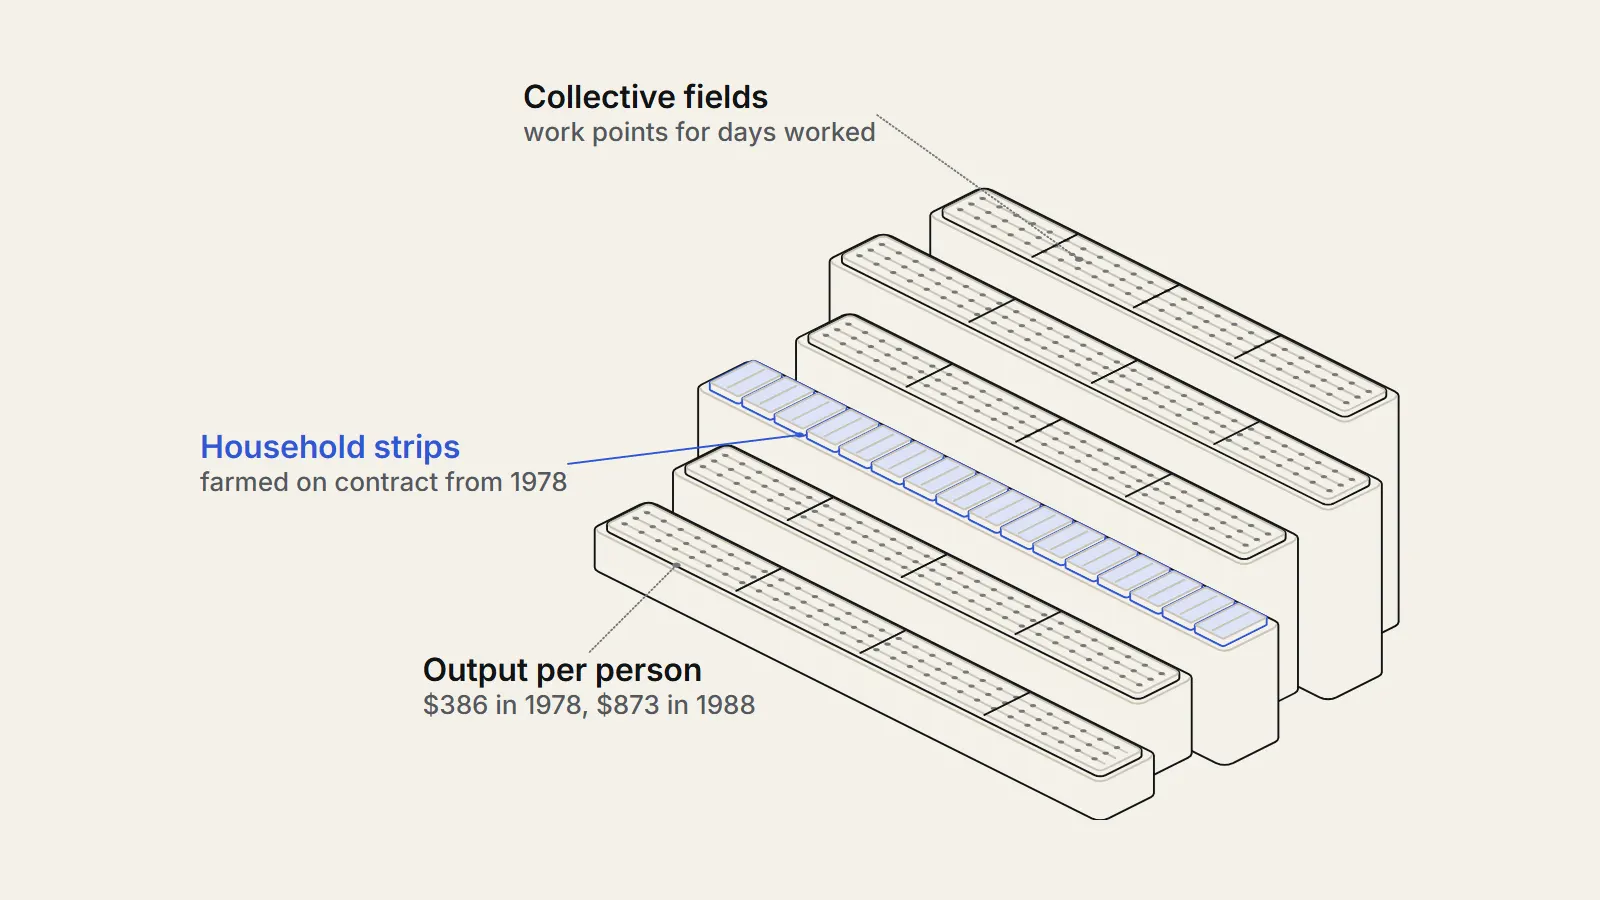
- From December 1978 the Party shifted its focus to economic modernisation, raised farm purchase prices, let households farm under contract, and added market prices beside the plan instead of scrapping it.
- Outcome
- Output per person rose from $386 in 1978 to $873 in 1988 (2015 prices); crop growth reached 6.8% a year in 1979-84; the share below $3.00 a day fell from 97% in 1981 to 0.0% in 2019. Which reform caused what is disputed.
China's 1978 economic reform did not start with a big bang. From December 1978 the Communist Party moved its focus to economic modernisation, paid farmers more for grain and began letting households farm on contract, while leaving most planned prices and state firms in place.3 Output per person rose about 2.3 times between 1978 and 1988, and the World Bank's count of people below $3.00 a day fell from 97 percent in 1981 to about zero in 2019.2
Before
What China's economy looked like before 1978
Before 1978 China ran what Chen, Jefferson and Singh, in a 1992 World Bank paper, call a mobilisation model. The state held down industrial wages and paid farmers low prices, so that cheap grain and raw materials fed heavy industry. The savings rate rose from under 10 percent in the 1950s to above 30 percent by the late 1970s1.1
That strategy has a limit. A country can only raise its savings rate and slow its population growth so far, after which living standards rise only if output per unit of input rises. Economists call that total factor productivity, the output left over once the labour and capital used are counted. The same paper reports that productivity in both farming and industry stagnated between 1957 and 1978.1
The incentives on the farm were part of the problem. Under collective farming, land was pooled and households earned work points for days worked. At year end the collective's net income was divided by the total points, so a household's pay was only loosely tied to its own effort, which was hard to monitor.4 That is a moral hazard problem: when effort is hard to see and reward is shared, each person has a reason to do a little less.4
Movement and trade were also fenced in. The hukou, or household registration system, was set up in 1958, and in practice a rural household could hardly obtain an urban permit.4 Total trade was only 5 percent of GDP in 1970 and 1971, and was handled by twelve national trading companies.4 In 1978 only 17.9 percent of the population lived in towns and cities, so about 82 percent lived outside them.2
The leadership's own verdict was blunt. The December 1978 communique (https://www.marxists.org/subject/china/peking-review/1978/PR1978-52.pdf) described agriculture, the foundation of the economy, as seriously damaged in recent years and very weak on the whole.3 The growth record was also uneven: real GDP fell 1.6 percent in 1976, rose 7.6 percent in 1977 and 11.3 percent in 1978.2 Output per person in 1978 stood at $386 in constant 2015 dollars.2
The decision
Deng Xiaoping's economic reforms: what the Party decided in December 1978
Deng Xiaoping gave his speech on emancipating the mind (https://www.marxists.org/reference/archive/deng-xiaoping/1978/110.htm) on December 13, 1978, and on December 22 the Third Plenary Session of the 11th Central Committee adopted its communique. The official wording was a decision to shift the emphasis of Party work to socialist modernization.3 The economic substance sat in the passages on farming and on management.
But revolution takes place on the basis of the need for material benefit.
— Deng Xiaoping, speech of December 13, 1978, in defence of material incentives
In the same speech Deng said the most pressing need was to expand the decision-making powers of mines, factories and other enterprises, and he argued for letting some regions, enterprises, workers and peasants earn more and enjoy more benefits sooner than others.5 The communique echoed the point on authority, calling for power to be shifted down so that local authorities and enterprises have more say in management.3
The farm measures were concrete. The state would raise its grain purchase price by 20 percent from 1979 and the price for grain bought above the quota by a further 50 percent. It would also cut the factory prices of farm machinery, fertiliser and similar inputs by 10 to 15 percent in 1979 and 1980.3 To keep the cities quiet, the text promised that urban workers would be guaranteed against a fall in living standards and that the selling price of food grain would stay unchanged, with subsidies where needed.3
Just as telling is what the communique left in place. In the passages we read, the production team remains the basic accounting unit, state grain purchases stay tied to the 1971-75 quotas, and private plots and village fairs are protected as adjuncts of the socialist economy.3 Household farming does not appear in the passages we read. It grew from below.
What was the household responsibility system in China?
The household responsibility system, or HRS, was first introduced in Anhui province in late 1978 after a severe drought. At first the government let only poor, remote and mountainous areas experiment.6 Under the HRS, land stayed nominally collective but was contracted to households, first on a 5-year lease, then for 15 years from 1984 and 30 years from 1993.7 Only 1.02 percent of production teams had converted by the end of 1979; by the end of 1983 the share was 98 percent6.6
- Dec 13, 1978Deng Xiaoping's speech on emancipating the mindHe argues for material incentives and enterprise autonomySource 5 (opens the source in a new tab)
- Dec 22, 1978Third Plenum communique adoptedFocus shifts to socialist modernization; agriculture firstSource 3 (opens the source in a new tab)
- 1978-79Local household-contracting experiments in Anhui and SichuanSource 4 (opens the source in a new tab)
- 1979State procurement prices for farm goods riseAverage procurement prices rose 22.1 percent in 1979Source 6 (opens the source in a new tab)
- 1979Township and village firms allowed to do business for profitSource 4 (opens the source in a new tab)
- 1979-80Special economic zones established to attract foreign investmentSource 4 (opens the source in a new tab)
- 1983Virtually all arable land contracted to households98 percent of production teams on the HRS by year endSource 7 (opens the source in a new tab)
- 1984Central Document No. 1 sets 15-year land contractsSource 7 (opens the source in a new tab)
- 1984Urban industrial reform begins formallyManagement contracts, profit retention, wider autonomySource 1 (opens the source in a new tab)
- 1985Policy allows some households and regions to become wealthy firstSource 4 (opens the source in a new tab)
- 1988-89Consumer-price inflation reaches 18.8 and 18.2 percentSource 2 (opens the source in a new tab)
- 1998Privatisation of small and medium state firms beginsLarge-scale privatisation had been postponed until thenSource 4 (opens the source in a new tab)
The two-track idea: plan and market side by side
The city and factory reforms followed the same pattern. China's urban industrial reform did not begin formally until 1984, and it did not look like the big-bang programmes later tried in Eastern Europe. It gave enterprises multi-year management contracts, the right to keep part of their profits, and more freedom to choose output and to buy and sell on the market, while cutting but not eliminating the allocations made within the plan.1
This is the dual-track, or two-track, price system. Quantities set by the plan continue to trade at state prices, while output above the plan can be sold at market prices. Lau, Qian and Roland model it as a way to reach efficiency-improving reform without creating losers: the plan keeps being enforced while the market grows beside it, which works like implicit transfers that compensate those who would otherwise lose.8
changing a big earthquake into several small tremors
— How the dual price system was widely described, as reported by Chen, Jefferson and Singh (1992)
The state's grip loosened gradually. The state sector produced 90 percent of China's industrial output in 1978, and the authors put its share at barely above 60 percent when they wrote in 1992.1 Large-scale privatisation waited until 1998.4 Gradualism here meant the removal of market frictions step by step, in contrast with the shock therapy of the former Soviet Union, which aimed to eliminate them simultaneously.4
The strongest case against the 1978 reform
We found no 1978 document from an opponent on a page we opened, so we state the case as scholars have assembled it. It has three strands: that collective farming had real strengths, that a half-reformed price system breeds its own distortions, and that the gains would come with costs that fall unevenly.
Each strand has evidence behind it. Sun and Chen describe a school of revisionist scholars who emphasise the alleged efficiency of agricultural collectives in exploiting scale, notably in irrigation, and who remain nostalgic for the collective era's capacity to mobilise resources for public goods.6 Even Sun and Chen, who find the HRS helped, accept that the revisionists' claims are not entirely without merit.6
On prices, the World Bank authors list the costs of reform directly: growing inequality, rising insecurity, greater price instability, rising corruption and greater political and social instability.1 They say the dual pricing system, meant to be transitional, has invited pervasive corruption.1 The mechanism is plain: when inflation widens the spread between plan and market prices, the potential gains from corruption grow.1 They add that some problems, including the acceleration of inflation in 1988 and 1989, might have been avoided with a different reform strategy.1
The communique itself shows how worried planners were about risk. Raising farm prices would squeeze urban households, so the text promised that urban workers would not lose and that grain selling prices would not rise.3 The state would pay the difference. That is a cost to the budget, and a bet that growth would arrive before the bill did.
- Scale and public goods: collective farms built irrigation that individual households could not easily replace.
- Dual prices: the gap between plan and market prices rewarded connections, and corruption followed.
- Inequality: policy from 1985 openly let some households and regions become wealthy first.
- Risk: a market economy brings job and price insecurity that the plan had hidden.
What happened
What the numbers show: growth after China's 1978 economic reform
The first thing the data show is a faster and steadier economy. Chen, Jefferson and Singh report real GDP growth of 6.4 percent a year in 1965-80 and 10.4 percent in 1980-88, with total GNP up 2.5 times between 1978 and 1988.1 Chen and Zha put average growth at about 10 percent a year from 1978 until the Covid crisis.4 The earlier period in the first comparison includes the opening reform years, so the contrast, if anything, understates the break.
Growth was not smooth. The World Bank series shows 5.1 percent in 1981, then 10.8 percent in 1983 and 15.2 percent in 1984, and a fall to 4.2 percent in 1989 and 3.9 percent in 1990.2 The slump coincided with a burst of inflation: consumer prices rose 7.2 percent in 1987, 18.8 percent in 1988 and 18.2 percent in 1989, before easing to 3.1 percent in 1990.2
In farming, crop production grew 6.8 percent a year in 1979-84 against 2.5 percent in 1953-781, and agricultural labour productivity rose 4.7 percent a year in 1978-84.1 A 2014 World Bank report with the State Council's research centre calls the HRS the most important driving force behind agricultural growth and poverty reduction in the first decade of reform.7 The gain faded: crop growth slowed to 1.0 percent a year in 1984-88, and the authors list several candidate reasons.1
The benefits spilled out of agriculture. Rural township and village enterprises, or TVEs, received no state budget money, yet they contributed over 30 percent of the growth in total material production in 1980-881, and their share of GNP rose from 13 to 21 percent.1 The share of the rural workforce in non-farm work went from about 10 percent in 1978 to 21 percent in 1988, and more than 67 million rural workers were absorbed by TVEs in the 1980s.1
Industry also became more productive. Total factor productivity in state industry grew 2.4 percent a year in 1980-88, and 4.6 percent in the collective sector, which includes TVEs, after roughly stagnating in 1957-78.1 Foreign trade rose five fold between 1978 and 1988, from $20.6 billion to $102.8 billion.1 The authors warn that official output figures are likely to be biased upward.1
For households, the World Bank series shows output per person rising from $386 in 1978 to $873 in 1988, about 2.3 times (our calculation), and to $12,484 by 2023.2 In 1978-88, rural per capita real income grew 9.6 percent a year and urban income 6.3 percent.1 The urban share of the population went from 17.9 percent in 1978 to 26.2 percent in 1989 and 65.5 percent in 2023.2
The poverty series uses the World Bank's $3.00-a-day line at 2021 purchasing-power prices.2 It shows 97 percent below the line in 1981, 62.6 percent in 1996, 6.0 percent in 2013 and 0.7 percent in 2018, rounding to zero from 2019.2 Much of this decline came after 1990, so it reflects the whole reform era and later policy, not the 1978 decisions alone.
The costs that came with it
The costs the critics named did appear. The 1985 decision to let some households and regions become wealthy first came with rising inequality: Chen and Zha report the top 10 percent income share rising from 27 percent to 41 percent between 1978 and 2015, a figure they take from other researchers.4 Inflation in 1988 and 1989 has already been shown above. In their 1992 paper, Chen, Jefferson and Singh add that the democracy movement and its suppression in spring 1989 may be less a symptom of economic reform than of a recurring problem of leadership succession.1
The authors also warn that higher incomes were partly needed just to compensate people for the greater risk of a market economy, since they found evidence of risk aversion in China.1 Rising insecurity is a cost even when average incomes rise.
What economists still disagree on
Why economists still dispute China's 1978 economic reform
Three questions remain open: which reform did the work, how reliable the data are, and whether the experience travels. We take them in turn.
Did the household responsibility system raise output?
The standard view says it did. Lin's 1992 study is cited as finding that decollectivisation contributed 49 percent of agricultural output growth in 1978-84.9 McMillan, Whalley and Zhu earlier attributed 78 percent of productivity growth to the HRS and 22 percent to higher prices, though Sun and Chen note that this split rests on simplifying assumptions.6 Xu (2012) found that the HRS effect loses statistical significance when a lagged adoption variable is used.6
Sun and Chen respond that adoption was not random, since poor and drought-hit areas moved first. They use weather shocks as instruments and still find a significantly positive effect, larger than ordinary estimates suggest.6 Ferguson and Kim reach a different result with satellite images. Their method, which does not rely on official statistics, finds no evidence that adopting the HRS sooner raised grain yields, and its 95 percent interval rules out effects above 0.5 percent.9
Ferguson and Kim also point to a timing puzzle: official yields rose almost 20 percent by 1980, when fewer than 20 percent of teams had adopted the HRS, whereas the price increase was national and came in 1979.9 In 1979 the quota grain price rose 20 percent and the above-quota bonus went from 30 to 50 percent.9 They add that satellites see land productivity, not labour productivity. Their results cannot rule out the HRS having freed labour for non-farm work, and they find it raised built-up land and non-farm activity.9
How far can the Chinese data be trusted?
Ferguson and Kim describe Chinese economic statistics as notoriously unreliable.9 The World Bank paper says its own figures are likely to be biased upward.1 The most careful audit we opened, by Carsten Holz (https://carstenholz.people.ust.hk/CarstenHolz-QualityChineseGDPStatistics-25Apr2015.pdf), concludes that the supposed evidence of falsification is not compelling, but that the statistics bureau has much institutional scope to falsify.10 Official data, he finds, conform to Benford's Law, a test of digit patterns, so the bureau either makes no significant use of that scope or knows the regularities when it does.10 We read that as an unresolved question, not as a verdict either way.
Was China's path a choice others could copy?
Chen and Zha find that from 1978 to 1997 gradualism helped mainly by moving surplus labour out of farming. After 1998 the focus shifted toward capital-intensive growth, which they say sustained GDP but raised trade tensions and threatened financial stability.4 The World Bank authors, for their part, stress the importance of kindred economies as reform models and sources of resources.1
| Economy | 1991 | 1995 | 2000 |
|---|---|---|---|
| China | 109.4 | 178.8 | 271.3 |
| Poland | 93.0 | 112.4 | 145.4 |
| Russia | 95.0 | 62.1 | 67.2 |
The table is tempting but does not settle the matter. China started reform with a large low-wage farm sector. Sachs and Woo set an experimentalist school, which credits China's gradual and distinctive institutions, against a convergence school, which stresses that China's dense population and low-wage agriculture favoured labour-intensive, export-led growth.11 On the second view, the lesson is about starting conditions as much as sequencing.
Chen, Jefferson and Singh, writing in 1992, add that partial reform in state industry was unlikely to have delivered gains without rapid rural reform and the entry of non-state firms.1 And Poland's output passed its 1990 level by 1995 on the World Bank series, so a faster transition cannot be written off as always slower.2
Would faster price and enterprise reform in the 1980s have delivered the same growth with less inflation and corruption, or did the dual track make reform politically possible at all?
Lessons
What the China 1978 economic reform does and does not teach
Key takeaways
- The 1978 reform was a sequence of small steps: higher farm prices first, household contracting from below, market prices at the margin of the plan, and large-scale privatisation only from 1998.
- Output per person rose from $386 in 1978 to $873 in 1988, and the share below $3.00 a day fell from 97 percent in 1981 to about zero by 2019, though much of the fall came later.
- Which reform drove farm output is disputed: price rises, household contracting, or both, and independent satellite evidence challenges the standard story.
- The costs were real: inflation of 18 percent in 1988 and 1989, corruption tied to dual prices, and a rise in inequality.
What carries over is the mechanism. Giving producers a claim on what they produce, and letting new entrants compete while the old system continued, raised productivity without a sudden collapse of supply. What does not carry over automatically is the context: a labour-rich farm economy, kindred economies nearby as models and sources of investment, and a state able to subsidise grain prices. We cannot say from this evidence whether the same steps would work elsewhere.
Sources
- 1Lessons from China's Economic Reform (Research Paper Series CH-RPS #5) (opens the source in a new tab) · World Bank, Policy Research Department, 1992 · Paper · https://documents1.worldbank.org/curated/en/169101468914762305/pdf/Lessons-from-Chinas-economic-reform.pdf
- 2World Development Indicators: China series (real GDP growth NY.GDP.MKTP.KD.ZG, GDP per capita NY.GDP.PCAP.KD, poverty headcount at $3.00 a day SI.POV.DDAY, urban population share SP.URB.TOTL.IN.ZS, inflation FP.CPI.TOTL.ZG, trade share NE.TRD.GNFS.ZS, GDP NY.GDP.MKTP.KD for China, Russia, Poland) (opens the source in a new tab) · World Bank, World Development Indicators API (last updated 2026-10-08), 2026 · Dataset · https://api.worldbank.org/v2/country/CHN/indicator/NY.GDP.MKTP.KD.ZG?format=json
- 3Communique of the Third Plenary Session of the 11th Central Committee of the Communist Party of China (adopted December 22, 1978), Peking Review No. 52 (opens the source in a new tab) · Peking Review, December 29, 1978 (scan at marxists.org), 1978 · Primary source · https://www.marxists.org/subject/china/peking-review/1978/PR1978-52.pdf
- 4China's Macroeconomic Development: The Role of Gradualist Reforms (NBER Working Paper 31395) (opens the source in a new tab) · National Bureau of Economic Research, 2023 · Paper · https://www.nber.org/system/files/working_papers/w31395/w31395.pdf
- 5Emancipate the Mind, Seek Truth From Facts and Unite As One In Looking to the Future (speech of December 13, 1978) (opens the source in a new tab) · Marxists Internet Archive (Selected Works of Deng Xiaoping, vol. II), 1978 · Primary source · https://www.marxists.org/reference/archive/deng-xiaoping/1978/110.htm
- 6Measuring the Effects of Decollectivization on China's Agricultural Growth: A Panel GMM Approach, 1970-1987 (SDU Working Paper 2014-05) (opens the source in a new tab) · School of Economics, Shandong University, 2014 · Paper · https://www.nsd.pku.edu.cn/attachments/44127397f2eb4c61aa131c3dffd1bd4e.pdf
- 7Urban China: Toward Efficient, Inclusive, and Sustainable Urbanization (Supporting Reports) (opens the source in a new tab) · World Bank, 2014 · Report · https://www.worldbank.org/content/dam/Worldbank/document/EAP/China/Urban-China-SRs4-7.pdf
- 8Reform without Losers: An Interpretation of China's Dual-Track Approach to Transition (opens the source in a new tab) · Journal of Political Economy 108(1), pp. 120-143, 2000 · Paper · https://ideas.repec.org/a/ucp/jpolec/v108y2001i1p120-143.html
- 9What Started China's Miracle? The View from Outer Space (opens the source in a new tab) · Working paper, version of March 27, 2026, 2026 · Paper · https://oliverwkim.com/papers/oliver_kim_JMP.pdf
- 10The quality of China's GDP statistics (China Economic Review 30) (opens the source in a new tab) · China Economic Review, 2014 · Paper · https://carstenholz.people.ust.hk/CarstenHolz-QualityChineseGDPStatistics-25Apr2015.pdf
- 11Understanding China's Economic Performance (NBER Working Paper 5935) (opens the source in a new tab) · National Bureau of Economic Research, 1997 · Paper · https://www.nber.org/papers/w5935