Where you’ve heard it
“House prices always go up. You're throwing money away by renting, and paying your landlord's mortgage while you're at it.” — The Motley Fool, Lyle Daly, 8 October 2022. The article sets this out as common housing advice before examining it. Read the article (https://www.fool.com/money/mortgages/articles/why-ramit-sethi-believes-this-piece-of-housing-advice-is-financial-propaganda).
House prices always go up. You're throwing money away by renting, and paying your landlord's mortgage while you're at it.
Why people believe it
What the evidence shows
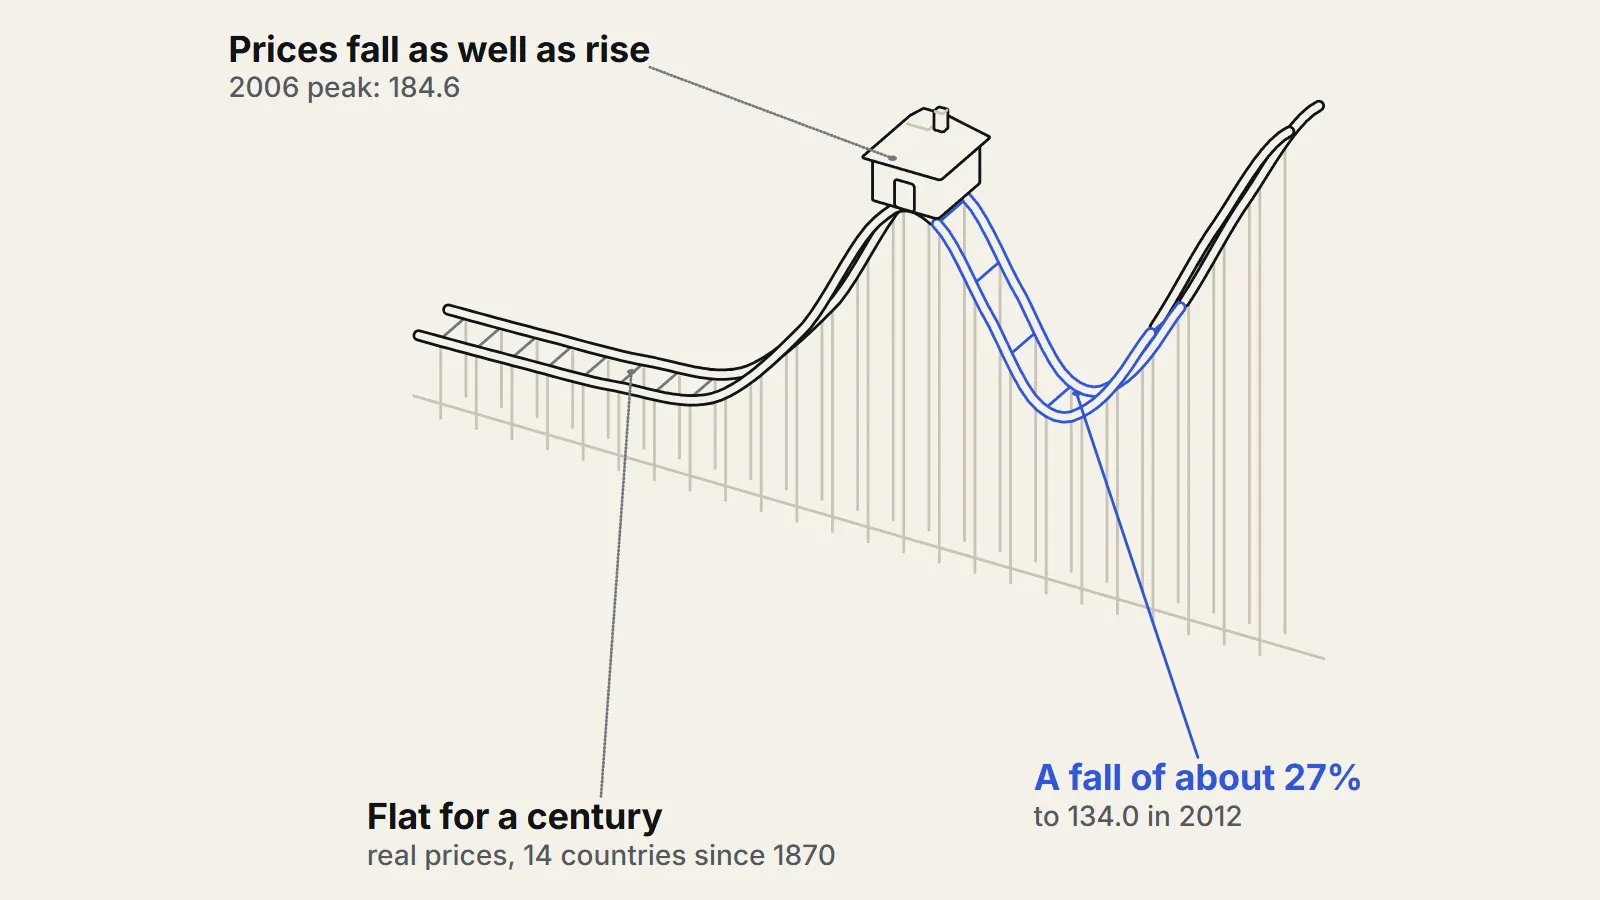
The longest house price record comes from a study of 14 advanced economies going back to 1870. It found that prices, once inflation is removed, stayed roughly constant from the nineteenth century to the middle of the twentieth century2, and rose strongly only after the Second World War, with big differences between countries.2 The authors link most of the postwar rise to the rising price of land rather than the cost of building. See the paper in the American Economic Review (https://www.aeaweb.org/articles?id=10.1257/aer.20150501).
So the sense that prices simply climb comes mostly from the last 70 years. Before that, a home was not a reliable way to grow wealth in real terms, though it paid rent to the owner.
Recent history also has a sharp counter-example. The Case-Shiller US national index peaked at 184.6 in July 2006 and bottomed at 134.0 in February 2012, a fall of about 27 percent in nominal terms3.3 Consumer prices rose about 12.5 percent over the same stretch, which by our own calculation turns the fall into about 35 percent after inflation.4 The index has since recovered strongly, reaching 337.3 in July 2026, about 83 percent above its 2006 peak before adjusting for inflation. The series is on the St. Louis Fed FRED site (https://fred.stlouisfed.org/data/CSUSHPINSA.txt).
The case for housing as an investment rests on rents too. The 16-country study counts rental income as part of the return, so its figure of about 7 percent a year is not the same as price growth alone.1 It also finds that housing beat shares before the Second World War, and that shares have beaten it on average since, at the cost of larger swings.
What is not known: national averages hide big local differences, and the early price records for some countries lean on city data, so the pre-war picture is less certain than the modern one. Nobody can say whether the post-1950 pattern of rising land prices will continue.
The better question
A better question: after inflation, rent saved and the cost of owning, how much has a home in this particular place, bought at this particular time, been worth over the years someone expects to hold it?
Sources
- 1The Rate of Return on Everything, 1870-2015 (opens the source in a new tab) · Federal Reserve Bank of San Francisco Working Paper 2017-25, 2017 · Paper · https://www.frbsf.org/wp-content/uploads/wp2017-25.pdf
- 2No Price Like Home: Global House Prices, 1870-2012 (opens the source in a new tab) · American Economic Review, 2017 · Paper · https://www.aeaweb.org/articles?id=10.1257%2Faer.20150501
- 3S&P Cotality Case-Shiller U.S. National Home Price Index (CSUSHPINSA) (opens the source in a new tab) · FRED, Federal Reserve Bank of St. Louis, 2026 · Dataset · https://fred.stlouisfed.org/data/CSUSHPINSA.txt
- 4Consumer Price Index for All Urban Consumers (CPIAUCSL) (opens the source in a new tab) · FRED, Federal Reserve Bank of St. Louis, 2026 · Dataset · https://fred.stlouisfed.org/data/CPIAUCSL.txt