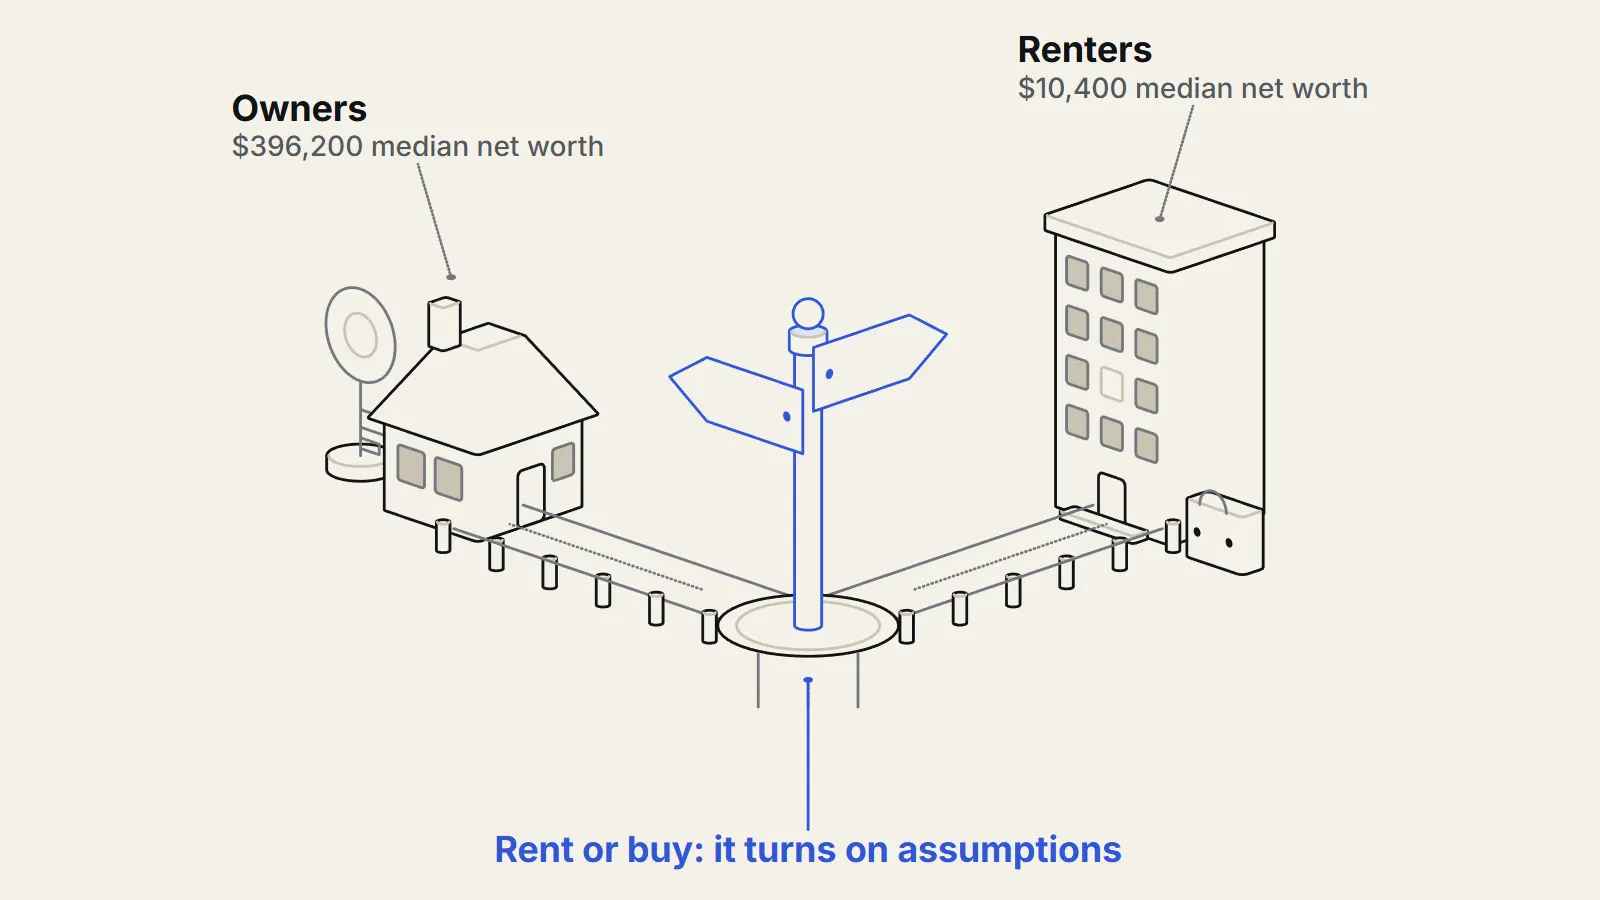
Whether renting or buying costs less depends on a short list of assumptions, not on a general rule: how long the household stays, how high prices are relative to rents, the mortgage rate, how fast the home is expected to gain value, and what the down payment would otherwise earn. Economists compare the yearly cost of owning a home with the rent on a similar one. When ownership costs less per year, buying wins on paper; when it costs more, renting does. Small changes in the assumptions can reverse the result, which is why the renting vs buying maths is best read as a way to test assumptions, not a verdict. This article explains the method and does not recommend either choice.
How do economists compare the cost of renting and buying?
The standard tool is the user cost of housing. In a 2005 New York Fed staff report (https://www.newyorkfed.org/medialibrary/media/research/staff_reports/sr218.pdf), Charles Himmelberg, Christopher Mayer and Todd Sinai argue that the purchase price of a house is not its cost of living in it for a year. The right comparison sets the rent you would otherwise pay (the value of living there, called imputed rent) against the income you give up by tying money up in the house, adjusted for risk, taxes, property tax, maintenance and any expected rise in the home's value.1 The result is a yearly cost expressed as a fraction of the home price. If price times that fraction exceeds the market rent, housing is relatively costly to own.
The authors illustrate with assumptions of their own: a 5.5 percent mortgage rate, a 25 percent marginal tax rate, a 1.5 percent property tax rate, 2.5 percent for depreciation, a 2.0 percent risk premium and 3.8 percent expected price growth. Those give a user cost of 5.0 percent, so a household should pay up to about 20 times the yearly rent to buy.1 On $1,000 a month in rent, that is a price of $240,000. These are 2005 illustrative numbers, not today's market.
Which assumptions flip the answer?
The method is sensitive. In the same paper, assuming a real appreciation rate of 2.8 percent instead of 1.8 percent lowers the user cost to 4 percent and lifts the break-even price-to-rent ratio from 20 to 251.1 A one-percentage-point fall in real interest rates lifts it from 20 to 23.8. In both cases the break-even moves by roughly a fifth or more without anything about the house changing. The reverse also holds: if buyers expect little price growth, or rates are high, owning looks costlier.
Time horizon matters for another reason. Buying and selling carry costs that renting does not. For sellers, the traditional norm was that the seller paid each agent as much as 3 percent of the home value2, about 6 percent in all, according to a 2025 Federal Reserve note on broker pay (https://www.federalreserve.gov/econres/notes/feds-notes/commissions-and-omissions-trends-in-real-estate-broker-compensation-20250512.html). The note finds the average buyer-agent rate has drifted down to about 2.7 percent, and it says there is no comprehensive data on the seller side.2 If a $400,000 home were sold for 6 percent in commission alone, that would be $24,000 before other closing costs and moving. Spread over two years, that is a heavy cost; spread over fifteen, it is small. This is arithmetic on the cited rate, not a figure from the note.
Prices relative to rents are also a moving input. A 2025 Dallas Fed analysis found the US house price-to-rent ratio had risen about 20 percent since early 2020 and was near its 2006 peak, though it had fallen about 3 percent since 2022.3 The same analysis found prices and rents have generally moved together over the long run, with only two large gaps since 1984, both after rapid price rises. The Dallas Fed analysis (https://www.dallasfed.org/research/economics/2025/0225) does not address whether to buy or rent; it shows that the starting ratio is not constant.
What does owning cost beyond the mortgage payment?
Not every dollar of a mortgage payment is a cost. The part that repays principal builds equity, the owner's share of the home. Interest, property tax, insurance, upkeep, and the foregone return on the down payment are the true yearly costs. Tax rules also matter. Mortgage interest only reduces taxes for households that itemise deductions, and the standard deduction for 2026 is $16,100 for a single filer and $32,200 for a married couple filing jointly, so a household whose itemised deductions fall below those amounts gets no extra tax benefit from its mortgage interest.4 Whether a given household itemises depends on its own numbers.
Do homeowners really end up richer than renters?
The data show a wide gap. The Federal Reserve's 2022 Survey of Consumer Finances put median net worth at $396,200 for homeowner families and $10,400 for renter and other families5, and 66.1 percent of families owned a primary residence.5 Median means the middle family, so it is not pulled up by a few very wealthy households.
A reader should hesitate before reading that gap as the effect of buying. The survey compares groups at one time, and families who own differ from those who rent in income, age and savings before any purchase. The data cannot show how much of the gap owning itself caused, and the renter group is labelled "renter or other", so it includes some people who do not pay rent. What the figures do support is that housing dominates the balance sheet of a typical middle-wealth family, so the choice shapes household wealth.
What is the best argument on each side?
The other side stresses that ownership works as forced saving: principal repayments build equity that a renter must replace with deliberate saving, and a fixed-rate mortgage locks in one housing cost for decades while rents can rise. Both arguments are about assumptions: what the renter does with the difference, how long each household stays, and where prices go.
What is not known?
No source here can say what home prices, rents or mortgage rates will do over any household's horizon, and those inputs drive the result. Maintenance and risk premiums vary by home and city, the 2005 illustration may not reflect current conditions, and the evidence on seller costs is incomplete. A household can test its own case by changing one input at a time and seeing when the answer flips.
Key takeaways
- The comparison is between the yearly cost of owning (interest, property tax, upkeep, forgone return, net of expected price growth) and the rent on a similar home.
- Small changes in assumptions, such as 1 percentage point of expected price growth or of interest rates, can move the break-even price-to-rent ratio by roughly a fifth or more.
- Selling costs, including agent commissions traditionally near 6 percent of the price, favour renting for short stays.
- Median homeowner families had far more wealth than renters in the Fed's 2022 survey, but the data cannot show how much of that gap owning caused.
- Mortgage interest only cuts taxes for households that itemise, so the benefit does not reach everyone.
Sources
- 1Assessing High House Prices: Bubbles, Fundamentals, and Misperceptions (opens the source in a new tab) · Federal Reserve Bank of New York, 2005 · Paper · https://www.newyorkfed.org/medialibrary/media/research/staff_reports/sr218.pdf
- 2Commissions and Omissions: Trends in Real Estate Broker Compensation (opens the source in a new tab) · Board of Governors of the Federal Reserve System (FEDS Notes), 2025 · Report · https://www.federalreserve.gov/econres/notes/feds-notes/commissions-and-omissions-trends-in-real-estate-broker-compensation-20250512.html
- 3Evidence suggests U.S. house price/rent ratio, real home prices to decline (opens the source in a new tab) · Federal Reserve Bank of Dallas, 2025 · Report · https://www.dallasfed.org/research/economics/2025/0225
- 4IRS releases tax inflation adjustments for tax year 2026, including amendments from the One, Big, Beautiful Bill (opens the source in a new tab) · Internal Revenue Service, 2025 · Primary source · https://www.irs.gov/newsroom/irs-releases-tax-inflation-adjustments-for-tax-year-2026-including-amendments-from-the-one-big-beautiful-bill
- 5Changes in U.S. Family Finances from 2019 to 2022 (opens the source in a new tab) · Board of Governors of the Federal Reserve System, 2023 · Report · https://www.federalreserve.gov/publications/october-2023-changes-in-us-family-finances-from-2019-to-2022.htm