- Place
- Auckland, New Zealand
- Years
- 2016–2026
- Policy
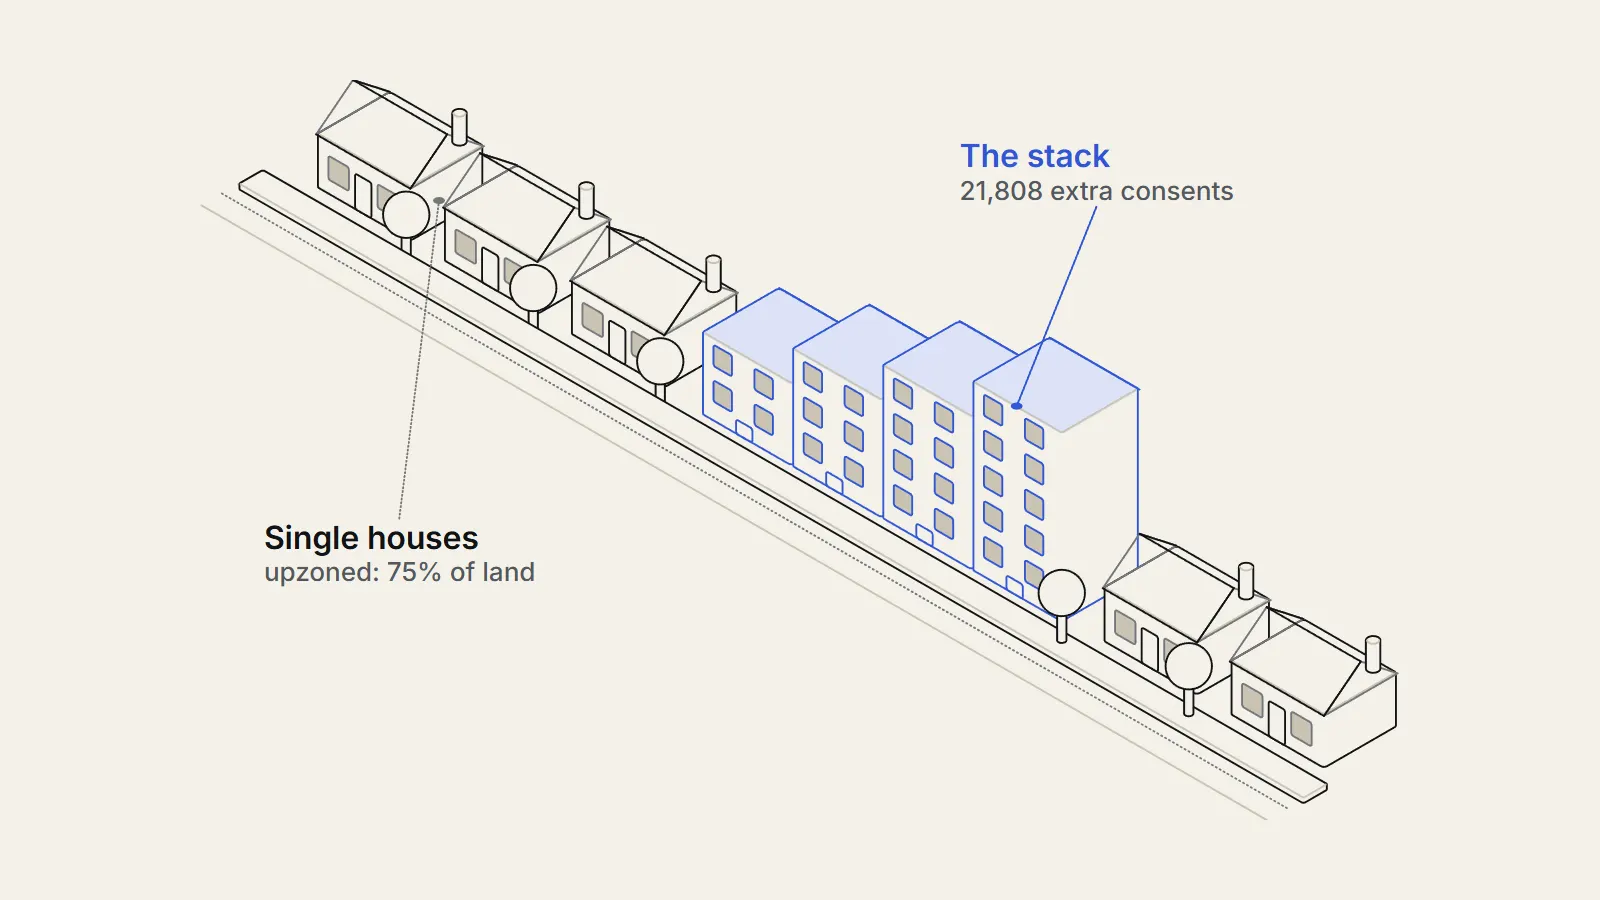
- Auckland's Unitary Plan became operational on 15 November 2016 and relaxed building rules on about three-quarters of residential land, with feasible capacity modelled at 422,000 dwellings.
- Outcome
- Consents roughly doubled from about 42,000 to 97,000 across the five years either side of the plan; one study attributes 21,808 extra consents to it and rents 26 to 33 percent lower. Critics dispute the counterfactual.
Auckland upzoning came into force on 15 November 2016, when the Auckland Unitary Plan relaxed building rules on about three-quarters of the city's residential land3.3 Researchers at the University of Auckland estimate it brought roughly 21,800 extra dwelling consents in five years3 and that rents for family-sized homes ended up well below where a comparison group suggests they would have been.34 Other economists argue those estimates mistake a normal housing cycle for a policy effect, so the size of the effect is contested.5
Before
This case study follows the Auckland upzoning from its planning process to the evidence on building and rents. We set out what the plan did, what the main studies found, what the critics say, and where the data cannot settle the question. The studies mostly measure building permits, so we keep consents, completions and rents distinct throughout.
Before 2016: a shortfall and seven sets of rules
Auckland entered the planning exercise with a housing backlog. The panel that reviewed the plan accepted estimates of long-term demand for an additional 400,000 dwellings, a current shortfall of around 40,000 dwellings, and annual demand of about 13,000.1 Its own modelling found the plan as first notified would enable only 213,000 dwellings1 that were financially feasible to build, well short of that demand.1
The rules the plan replaced were fragmented. Before the amalgamation of councils, Auckland's land was governed by seven city and district plans, which between them had roughly 115 residential zones.3 Researchers describe the city's consenting rate as having been one of the lowest in the Australasian region before the reform.2
An interim policy offered a taste of what was coming. Special Housing Areas, launched in September 2013 as part of a national inclusionary zoning programme, gave developers faster consenting in exchange for a 10 percent affordable housing provision, and an agreement let them build under the preliminary version of the plan. The number of dwellings consented under it was comparatively small.2
That distinction between permission and construction is the heart of the Auckland debate, and the panel itself drew it. It wrote that enabling sufficient capacity in the plan is only one step toward realising it, because the plan does not by itself make capacity available.1
The decision
The Auckland Unitary Plan: how it was decided
The Auckland Unitary Plan, or AUP, was the first single planning document for the amalgamated city, and the Hearings Panel's report (https://www.qldc.govt.nz/media/xbdbdgia/recommendations-on-proposed-auckland-unitary-plan-22-july-2016.pdf) is the main official record of how it was shaped. The council released a draft on 15 March 2013, then a Proposed plan on 30 September 2013, which drew more than 13,000 submissions with over 1.4 million separate points.3 The government appointed an Independent Hearings Panel, which held 249 days of hearings between April 2014 and May 2016 and considered more than 10,000 items of evidence.31
The Panel's report of 22 July 2016 recommended doubling feasible enabled capacity to more than 400,000 dwellings. Its reasoning was about risk: demand and supply are uncertain over the long term, and the costs of under-enabling capacity are much more severe than the costs of over-enabling it.1
should err toward over-enabling
— Independent Hearings Panel, Report to Auckland Council: Overview of recommendations, 22 July 2016
The Council's own changes had already moved the estimate. After the capacity shortfall emerged, it filed revised rules in late 2015 that removed density rules in the mixed housing zones above certain site sizes, taking feasible capacity from 213,000 to 296,000 dwellings. The Panel's recommended plan lifted it to 422,000.1
Other housing policies were running at the same time. The authors of the main consents study list loan-to-value limits on new mortgages from 2013, a limited capital gains tax from 2015, and restrictions on foreign ownership from 2018, and argue that no concurrent policy could plausibly generate so large an increase in construction.3
The plan was not only about infill. The Panel also recommended keeping the Rural Urban Boundary but expanding it to include 30 percent more land, and it recommended deleting the specific objectives and rules for retained affordable housing, so the plan relied on supply and not on an affordability quota.1
The council released its decisions version on 19 August 2016. It voted down several Panel recommendations, including one to abolish minimum floor sizes on apartments, but kept the abolition of minimum lot sizes for existing parcels. The plan became operational on 15 November 2016.3
The scale of the change is clear in the land data. Between 256 and 260 of the 335 square kilometres of residential land, or 76.4 to 77.6 percent, was upzoned. Much of it lay between 5 and 25 kilometres from the central business district and close to the transport network.2
- March 15, 2013Auckland Council releases the draft Unitary PlanSource 3 (opens the source in a new tab)
- September 2013Proposed plan notified; Special Housing Areas beginSource 2 (opens the source in a new tab)
- April 2014 to May 2016Independent Hearings Panel sits for 249 daysSource 3 (opens the source in a new tab)
- July 22, 2016Panel recommends doubling feasible capacity to more than 400,000 dwellingsSource 1 (opens the source in a new tab)
- August 19, 2016Council publishes its decisions version of the planSource 3 (opens the source in a new tab)
- November 15, 2016Plan becomes operationalSource 3 (opens the source in a new tab)
- May 2023Journal of Urban Economics paper on consents published onlineSource 6 (opens the source in a new tab)
- November 2024Motu working paper reviews the critiques of the studiesSource 6 (opens the source in a new tab)
- October 2026Auckland Council economists cite two studies of extra consentsSource 7 (opens the source in a new tab)
The case against reading the boom as an upzoning effect
The strongest challenge came from two critics, Cameron Murray and Tim Helm. Five days after the main consents study went online, they published a blog post titled The Auckland myth (https://www.fresheconomicthinking.com/p/the-auckland-myth-there-is-no-evidence). They argued that the study excluded areas that, once included, reduce the apparent effect, that it measured consents and not completions, and that its methods overstated the impact.65
Their sharpest claim concerns the counterfactual. The study extrapolates a straight line for non-upzoned areas to define what would have happened without the plan. Housing markets are cyclical, Murray and Helm say, so a linear extrapolation of a short, volatile series is an unreliable guide. They calculate that fitting a curve in place of a line cuts the net effect from 22,000 extra consents to about 4,500.5
Murray told the New South Wales Legislative Council in 2024 that planning controls regulate the density of housing types but not the number of projects, and that the quantity of homes produced responds to market forces.8 He added that net additions to the housing stock grew rapidly only from 2023 and that this had coincided with rents rising faster in Auckland than in Wellington and other urban areas.8
The critique also raised costs. The post also includes a first-person account of congestion on the single road in and out of one suburb and of public transport improvements that did not arrive.5 The Panel itself had warned that realising capacity requires substantial investment in infrastructure and expeditious consenting.1
What happened
What happened to building and rents after Auckland's upzoning
Building rose sharply. In the five years before the plan, from 2011 to 2016, Auckland consented about 42,000 dwellings. In the five years after it, from 2017 to 2022, it consented about 97,000. Attached dwellings, such as townhouses and apartments, rose from about 12,000 to 57,000, which pushed their share from 29.6 percent to 53.9 percent.2
Almost all of the rise was in the upzoned areas. Consents in upzoned areas increased by approximately 50,000, against about 5,000 in non-upzoned areas.2 In upzoned areas, the number of attached dwelling permits per year rose from under 1,000 in 2016 to near 10,000 in 2021.3
Those raw counts do not show cause. The Journal of Urban Economics paper (https://cowles.yale.edu/sites/default/files/2024-02/p1863.pdf) by Ryan Greenaway-McGrevy and Peter Phillips compares upzoned and non-upzoned areas within Auckland and allows for building shifting from one to the other. It estimates 21,808 additional dwelling consents over five years, roughly 4.11 percent of the dwelling stock, and finds the effect remains statistically significant under displacement effects that would require a four-fold rise in the trend rate of construction in control areas.3
The pattern of building moved too. Before the plan about half of consents were within 20 kilometres of the central business district, and after it about 60 percent were. The median distance from the centre fell from 19.9 to 17.9 kilometres, and the authors report that this change is driven by upzoned areas.2
Evidence on rents and the housing stock
Rents are the affordability test. The same lead author used a synthetic control, a weighted blend of other urban areas that tracked Auckland before 2016, to estimate what Auckland rents would have been without the reform. In the June 2023 working paper, rents for three-bedroom dwellings six years after full implementation were between 26 and 33 percent below the synthetic control4. Two-bedroom rents were 21 to 24 percent lower, but only under some specifications was that statistically significant.4
The author uses rents and not house prices for two reasons. Rents are not directly affected by the enhanced development rights, which accrue to the landowner, and rents capture a wider range of households because low-income households are more likely to be tenants. The rent series comes from the government's rental bond data, a geometric mean of weekly rents on new tenancies from 1993 to 2022.4
The result for larger homes fits how the old rules worked. Before the reform most residential land had a floor-area limit equal to that of detached single-family zoning, and in some targeted areas small minimum lot sizes were paired with restrictive floor-area ratios, which favoured smaller dwellings. The reform abolished minimum lot sizes on existing parcels and lifted the floor-area limit on three-quarters of residential land.4
Did the dwellings get built? The Policy Quarterly team that estimated Auckland's dwelling stock from council valuation records found 609,055 dwellings in August 2024, a net rise of about 91,000, or 17.6 percent,9 since the plan became operative in November 2016.9 Between August 2018 and August 2023 the stock rose by 61,209 units against 72,377 consented between September 2016 and August 2021, implying about one demolition for every nine homes built.6
Auckland Council's chief economist unit now describes the evidence as showing that housing supply increased, with more homes consented than would otherwise have occurred. It cites two estimates: 21,800 extra consents for 2016 to 2021 from comparing areas within Auckland, and 52,200 for 2016 to 2023 from comparing Auckland with other regions.7 The Council is also the planning authority, so we treat its summary as a statement of the evidence, not independent evaluation.
What economists still disagree on
Why economists disagree about the Auckland upzoning evidence
The dispute is largely about the counterfactual, the housing outcome without the plan. Three quasi-experimental studies are central. They use different comparison groups, and the Motu working paper summarises their findings, which differ in size.6
| Study | Outcome | Comparison | Headline estimate |
|---|---|---|---|
| Greenaway-McGrevy and Phillips (2023) | Dwelling consents | Upzoned against non-upzoned areas within Auckland | 21,808 extra consents after five years, about 4 percent of the stock |
| Greenaway-McGrevy (2023a) | Dwelling consents | Auckland against similar New Zealand cities that did not upzone | 43,500 extra consents within six years, about 9 percent of the stock |
| Greenaway-McGrevy and So (2024) | Rents | Auckland against similar New Zealand cities | Rents 28 percent lower six years on |
The disagreements fall into four groups.
- Sample: whether excluding Special Housing Area, rural and business consents biases the result.
- Counterfactual: whether a straight-line trend is a fair guide to consents without the plan.
- Consents and completions: how many permits became net new homes, and when.
- Comparison cities: whether Wellington and other cities are valid controls, given their own cycles and zoning changes.
Donovan and Maltman, who defend the studies in a Motu working paper, reply to Murray and Helm point by point. On sample selection, they say the study disclosed excluding Special Housing Area consents and rural and business areas and showed the result holds when these are included, with the break moving to 2013.6 On methods, they say the study uses a set of counterfactuals, not a single straight line.6 On completions, they say consents lagged 24 months track completions closely.6
Murray and Helm's original post made the counter-case, arguing that the study and its extension both depend on extrapolating a short cyclical series. They say that adding the missing consents makes the 2016 kink disappear, and that fitting a curve and allowing separate pre-trends turns the net effect negative, though they do not claim the plan reduced consents.5 They also say the consents boom looks like the cycle that followed a migration rise around 2014 in Wellington and Australian cities.5
we've seen nothing to justify the headlines
— Cameron Murray and Tim Helm, 'The Auckland myth', Fresh Economic Thinking, June 4, 2023
The counterfactual argument turns on numbers. Murray and Helm point out that annual growth in consents in the study sample averaged 12.1 percent in the five years before the plan, while the study's counterfactual involves only 5.7 percent growth afterwards.6 Donovan and Maltman answer that 2009 was Auckland's worst year for consents on record, that growth from such a low base is expected to slow as spare capacity is absorbed, and that consents also slowed in other New Zealand cities after 2016.6
On the comparison with other cities, Motu argues that an index chart which shows Wellington consents tracking Auckland's hides the levels: after 2016 Auckland consents rose from about 6 to 12 per 1,000 residents while Wellington's rose from under 4 to 7, and part of the Wellington region, Lower Hutt, itself upzoned from about 2017.6 Auckland averaged 5.9 consents per 1,000 residents a year from 1996 to 2015 and 6.3 in 2016, which is the base from which the later rise should be judged.6
Some points are easier to resolve than others. The completions question is partly empirical, and the valuation-roll and Census figures cited above suggest most consents became net new dwellings. The rent question is harder, because estimates move between versions: 22 to 35 percent in the May 2023 draft, 26 to 33 percent in June 2023, and 28 percent in the 2024 version with a co-author.46
Donovan and Maltman call the evidence remarkably robust, and say two economists' blog critiques have been cited in formal planning processes in Wellington and in a New South Wales parliamentary inquiry.6 One of the Motu authors, Matthew Maltman, wrote in 2023 that although he disagreed with the critique, he thought it was for the most part a good-faith engagement with the evidence, as relayed in a blog summary of the debate.10 Both sides argue from a position, so a reader should weigh each as an argument and not as a verdict.
The rent study states its own limits. Its comparison cities could be affected by migration, and the author argues that migrants drawn by cheaper housing in Auckland would push Auckland rents up and so bias the estimate towards zero. He also notes that Auckland's population fell by an estimated 1.1 percent between 2020 and 2022, widely attributed to the pandemic, and that other cities lost population too. In one check he ends the sample in 2020, when Auckland's population peaked, and reports unchanged conclusions.4 Geometric average rents are hard to adjust for the quality of dwellings let, because the bond data carry few attributes.4
Would Auckland rents have fallen relative to other cities if migrants, drawn by cheaper housing, had pushed demand up, and how large is that offsetting effect?
The limits matter. The main consents study is a short-run analysis, rents are measured on new tenancies, and a city that upzones three-quarters of its land at once leaves no untouched control within its housing market. The Panel's own capacity numbers are modelled outputs that it says should be treated as indicative only.1
Lessons
Key takeaways
- Permission is not construction. The Panel's capacity of 422,000 dwellings was a modelled ceiling, and what got built depended on demand, costs and infrastructure.
- Raw counts support a building rise: consents about 42,000 in the five years before the plan and about 97,000 in the five after. Cause needs a counterfactual, and that is where the studies diverge.
- Estimates of the extra consents run from about 4,500 on a critic's re-estimate to 21,808 and 52,200 in published studies, with different periods and methods.
- Rent evidence is promising but young: estimates for three-bedroom rents range from 22 to 35 percent below the synthetic control across versions.
What carries over is the logic: a rule change that makes redevelopment feasible on a very large share of land gives the market room to respond, and a supply response can show up first in consents. What does not carry over automatically is the size. Auckland had an unmet shortfall, a population growing quickly, and a plan applied to about three-quarters of residential land at once.
The policy conversation has moved on. In 2026 Auckland Council economists used a housing supply model to forecast that revised proposals for Plan Change 120, which would enable more housing near larger centres and public transport, would lift supply by about 36 percent, or 38,000 homes, over ten years and leave house prices around 3 to 5 percent lower than otherwise.7 These are model forecasts built on the observed response to the 2016 plan, not measurements, and they carry the same uncertainty about how much of that response was caused by the plan.
Our own caution is that the strongest estimates come from one research group using one city's data. The conclusion we are most comfortable with is that construction rose after the plan; we are least comfortable with a single figure for how much of it the plan caused.
Sources
- 1Report to Auckland Council: Overview of recommendations on the proposed Auckland Unitary Plan (opens the source in a new tab) · Auckland Unitary Plan Independent Hearings Panel, 2016 · Primary source · https://www.qldc.govt.nz/media/xbdbdgia/recommendations-on-proposed-auckland-unitary-plan-22-july-2016.pdf
- 2Can zoning reform change urban development patterns? Evidence from Auckland (opens the source in a new tab) · University of Auckland Economic Policy Centre Working Paper 012, 2023 · Paper · https://www.auckland.ac.nz/assets/business/012WP.pdf
- 3The impact of upzoning on housing construction in Auckland (opens the source in a new tab) · Journal of Urban Economics 136 (Cowles Foundation Paper 1863), 2023 · Study · https://cowles.yale.edu/sites/default/files/2024-02/p1863.pdf
- 4Can Zoning Reform Reduce Housing Costs? Evidence from Rents in Auckland (opens the source in a new tab) · University of Auckland Economic Policy Centre Working Paper 016 (June 2023 version), 2023 · Paper · https://www.auckland.ac.nz/assets/business/about/our-research/research-institutes-and-centres/Economic-Policy-Centre--EPC-/WP016%203.pdf
- 5The Auckland myth: There is no evidence that upzoning increased housing construction (opens the source in a new tab) · Fresh Economic Thinking (blog), 2023 · Essay · https://www.fresheconomicthinking.com/p/the-auckland-myth-there-is-no-evidence
- 6Dispelling myths: Reviewing the evidence on zoning reforms in Auckland (opens the source in a new tab) · Motu Economic and Public Policy Research (Working Paper 24-07), 2024 · Paper · https://motu-www.motu.org.nz/wpapers/24_07.pdf
- 7When more homes become possible: how proposed planning rules could make housing supply more responsive to demand (opens the source in a new tab) · Auckland Council Chief Economist Unit, 2026 · Primary source · https://knowledgeauckland.org.nz/media/xzjblg3e/when-more-homes-become-possible-auckland-council-ceu-insights-paper-10october-2026.pdf
- 8Submission by Dr Cameron K. Murray to NSW Legislative Council Portfolio Committee No. 7 - Planning and Environment (opens the source in a new tab) · Parliament of New South Wales, 2024 · Primary source · https://files.parliament.nsw.gov.au/fileapi/ParlFiles/GetArtifact/Dr%20Cameron%20Murray%20-%20received%2017%20June.pdf?serverRelativeUrl=%2Flcdocs%2Fother%2F20213%2FDr+Cameron+Murray+-+received+17+June.pdf
- 9Using Council Valuation Records to Estimate Auckland's Housing Stock (opens the source in a new tab) · Policy Quarterly 21(1), 2025 · Study · https://ojs.victoria.ac.nz/pq/article/download/9727/8586/15750
- 10A debate over Auckland's 2016 upzoning (opens the source in a new tab) · Vancouver Needs More Housing (Substack), 2023 · Essay · https://morehousing.substack.com/p/auckland-debate