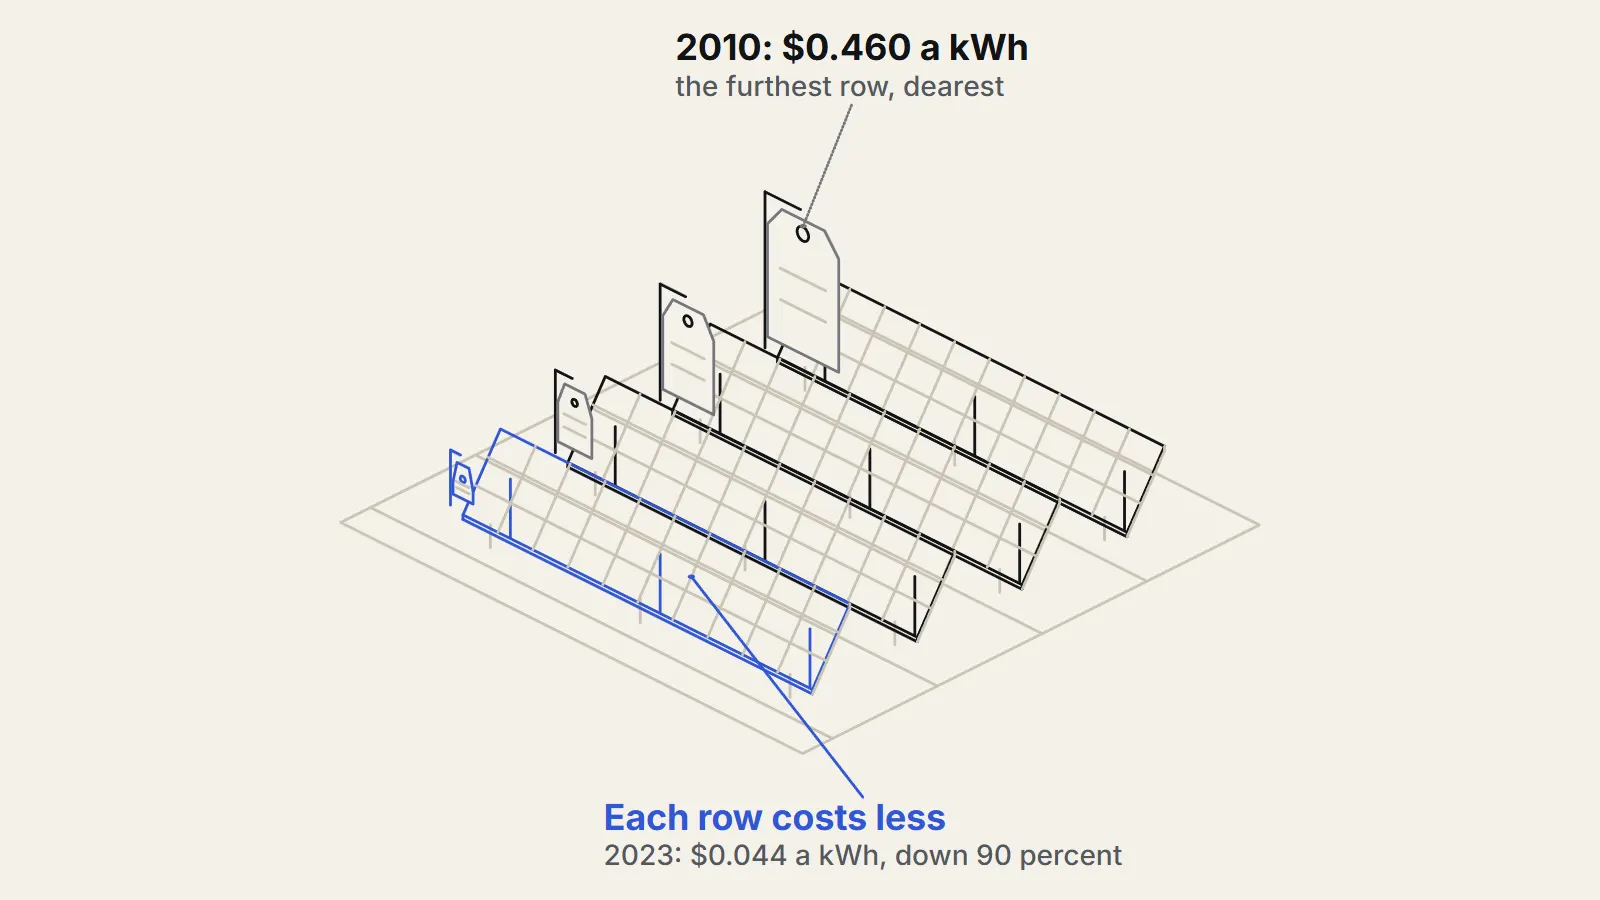
Why solar got cheap has a short answer and a longer, more contested one. The short answer: solar panels are manufactured goods, and factories got much bigger, cells turned more sunlight into power, and the main raw material, silicon, got cheaper. The longer answer is about why those things happened, and here researchers split between R&D, the scale effects of growing markets, and the policies that created those markets. The International Renewable Energy Agency (IRENA) reports that the global average cost of electricity from new utility-scale solar fell from USD 0.460 per kilowatt-hour in 2010 to USD 0.044 in 2023, a fall of 90 percent.1
How much cheaper did solar get?
The figure above is a levelised cost of electricity, or LCOE. It spreads the cost of building and running a plant over all the electricity it produces in its life, so it is a way of comparing a solar farm with a gas plant on one scale. In IRENA's 2023 cost report (https://www.irena.org/-/media/Files/IRENA/Agency/Publication/2024/Sep/IRENA_Renewable_power_generation_costs_in_2023_executive_summary.pdf), solar in 2010 was 414 percent more expensive than the cheapest fossil fuel option. By 2023 it was 56 percent cheaper than the least-cost fossil fuel option on a weighted average basis.1
Most of the fall came from the panels. IRENA says the drop in LCOE was driven mainly by module prices, which fell by around 93 percent between December 2009 and December 20231.1 The all-in installed cost of a solar project commissioned in 2023 was USD 758 per kilowatt, 86 percent lower than in 2010.1 Panels were not the whole story: the same report lists falls in installation, hardware and other "soft" costs between 2018 and 2023.
The longer history is steeper still. Our World in Data (https://ourworldindata.org/cheap-renewables-growth), drawing on earlier research, puts the price of a solar module at about $106 per watt in 1976, in inflation-adjusted dollars, when the world had only about 0.3 megawatts of installed capacity.2
What made solar panels cheaper to build?
The most careful attempt to split the decline into causes covers the years up to 2001. Gregory Nemet (https://wikis.mit.edu/confluence/download/attachments/21139745/Nemet_BeyondtheLearningCurve_EP_06.pdf?api=v2), then at the University of California, Berkeley, built a model of silicon module costs and checked which changes explained the fall. For the period from 1980 to 2001, when costs fell by a factor of seven, he found that the growth in factory size explained 43 percent of the fall in cost and higher cell efficiency explained 30 percent3. The falling price of silicon accounted for 12 percent.3 Each of the other factors he modelled added 3 percent or less.
These are plain engineering and business changes. Bigger plants spread fixed costs over more panels. A more efficient cell produces more power from the same wafer, glass and frame, so each watt costs less to make. Nemet also notes that purified silicon got cheaper in large part because of improvements in the much larger microprocessor industry, a spillover that the solar industry did not itself create.3
A later study (https://dspace.mit.edu/entities/publication/832a9fab-cd44-4bfe-8fba-ef13b7c5a491) by Goksin Kavlak, James McNerney and Jessika Trancik used a similar approach for 1980 to 2012. Higher module efficiency was again the largest single cause, accounting for nearly a quarter of the decline. Among broader causes, government and private R&D was the most important overall, but after 2001 economies of scale grew to nearly match it. The authors conclude that policies that stimulated market growth helped drive down costs, mainly by funding R&D and enabling scale, while simple learning by doing played a smaller role.4
Is it just a learning curve?
Many people explain solar with a learning curve, sometimes called Wright's law: each time the total amount made doubles, the unit cost falls by a fixed percentage. Our World in Data reports an average learning rate for solar modules of 20.2 percent per doubling of cumulative capacity across studies it cites.2 That pattern fits the data well, and it is useful for forecasting.
But a curve is a description, not an explanation. It does not say whether cost fell because people learned on the job, because money was spent on research, or because bigger orders justified bigger plants. Nemet's paper tested this directly and found that learning from experience only weakly explained the changes in plant size, module efficiency and silicon cost, the three factors that mattered most.3 The distinction matters because the cause decides which lessons carry over to other technologies.
What is disputed?
The strongest counterargument to a tidy story is that the causes are tangled together. Scale needs demand, demand was created partly by policy, and policy was in turn justified by the hope of lower costs. Kavlak and colleagues find that market-stimulating policies mattered, but their method assigns credit to R&D, scale and learning, not to individual policies, so it cannot rank, say, a feed-in tariff (https://therealigned.com/story/who-pays-a-tariff) against a research grant.4 Nemet's model also has a limit: for the early years from 1975 to 1979, the factors he modelled left 59 percent of the cost change unexplained, and he points to shifts in the market, such as the move from space to ground uses and rising competition, as possible reasons.3
There is also disagreement over how to measure. The Nemet and Kavlak studies look at module costs, while IRENA reports electricity costs for whole projects. The two are linked but not the same. IRENA also notes that China was 63 percent of the world's solar market in 2023, so global averages now reflect conditions in one country to a large degree.1
What is not known?
Several questions remain open. How much cheaper can solar get? Module costs are now a smaller share of a project, so further falls depend more on installation, hardware and financing. An LCOE also leaves out the cost of fitting variable power into a grid, such as storage or backup, and the figures above do not address that. And the studies cited here end in 2012 or earlier for the causal split, so they say little about the years since. No source opened for this piece measures how much of the most recent fall came from policy, subsidies or competition.
None of this is advice on whether to install panels. It is an account of how a technology that cost over a hundred dollars a watt in the 1970s became, in many markets, among the cheapest ways to generate electricity.
Key takeaways
- IRENA reports that the global average cost of electricity from new utility-scale solar fell 90 percent between 2010 and 2023, from USD 0.460 to USD 0.044 per kWh.
- Module prices fell about 93 percent from December 2009 to December 2023 and drove most of that fall.
- For 1980 to 2001, plant size explained 43 percent of module cost decline and cell efficiency 30 percent in Nemet's model; silicon cost explained 12 percent.
- Learning curves describe the fall well but do not by themselves show whether R&D, scale or learning by doing caused it.
- The causal split since 2012 is not well documented in the sources used here, and LCOE leaves out grid integration costs.
Sources
- 1Renewable Power Generation Costs in 2023 (Executive Summary) (opens the source in a new tab) · International Renewable Energy Agency, 2024 · Report · https://www.irena.org/Publications/2024/Sep/Renewable-Power-Generation-Costs-in-2023
- 2The price of renewables has fallen rapidly (opens the source in a new tab) · Our World in Data, 2020 · Dataset · https://ourworldindata.org/cheap-renewables-growth
- 3Beyond the learning curve: factors influencing cost reductions in photovoltaics (opens the source in a new tab) · Energy Policy 34(17), 3218-3232, 2006 · Paper · https://wikis.mit.edu/confluence/download/attachments/21139745/Nemet_BeyondtheLearningCurve_EP_06.pdf?api=v2
- 4Evaluating the causes of cost reduction in photovoltaic modules (opens the source in a new tab) · Energy Policy 123, 700-710, 2018 · Paper · https://dspace.mit.edu/entities/publication/832a9fab-cd44-4bfe-8fba-ef13b7c5a491