- Place
- Seattle, Washington, United States
- Years
- 2014–2022
- Policy
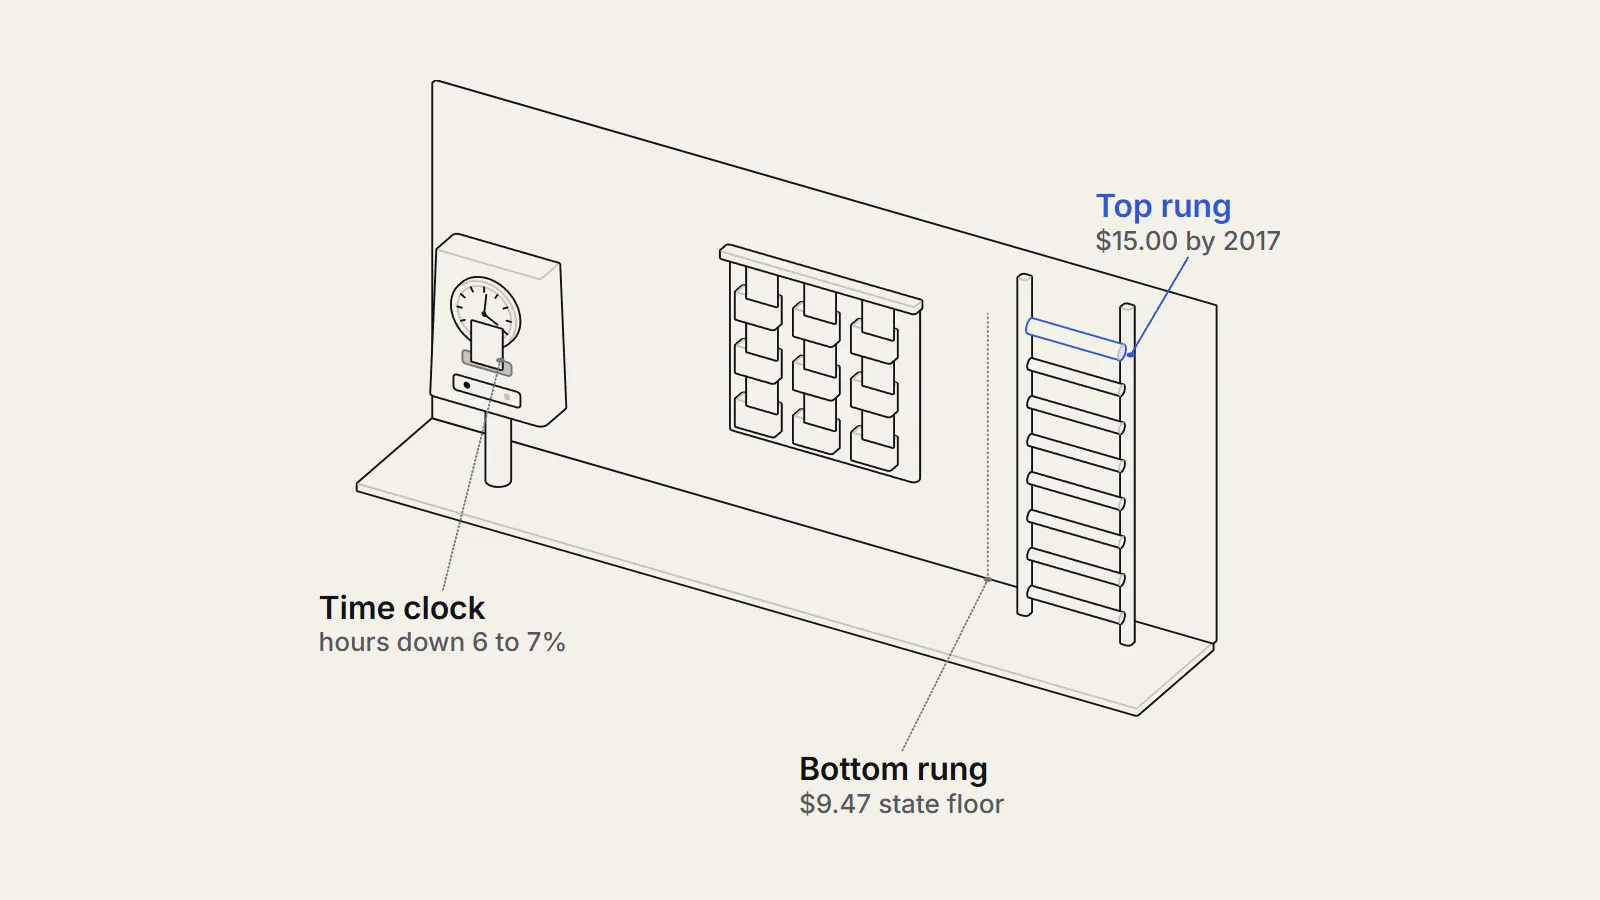
- Seattle enacted a phased minimum wage in June 2014, starting April 2015 and reaching $15 for large employers in 2017, with slower paths for small employers.
- Outcome
- University of Washington: hours in low-wage jobs fell 6 to 7 percent and wages rose 3 percent after the step to $13. Berkeley: food-service pay rose with no detectable job loss. The studies use different data and controls.
Seattle's $15 minimum wage has been studied by two prominent research teams, and the Seattle minimum wage study results split by method. The city passed its law in June 2014, started raising the floor in April 2015, and reached $15 for large employers in 2017.1 A University of Washington team found that after the step to $13 in 2016 hours worked in low-wage jobs fell 6 to 7 percent, while a Berkeley team found food-service pay rose with no loss of jobs.23
Before
This case study sets out what Seattle did, what each research team measured, why the two answers differ, and what the data cannot settle. We treat the findings as evidence about one city in one boom, not as a verdict on minimum wages everywhere.
Seattle in 2014: a high floor in a booming city
Seattle did not start from a low base. Washington State already had what the University of Washington team calls the nation's highest state minimum wage, $9.47 an hour, when the city began phasing in its own.2 The city was also growing quickly. A memo from Berkeley's Michael Reich notes that Seattle's unemployment rate had fallen to 2.6 percent by 2017 and that employment had grown from 510,000 to about 550,000 in a few years.4
That boom matters for every estimate that follows. A study has to separate the effect of the wage law from the effect of a hot labour market, and both research teams spent much of their effort on that problem.
The policy also ran ahead of earlier research. By June 2017 nine large cities and eight states had enacted wage floors in the $12 to $15 range, and the Berkeley brief notes that these levels lie well beyond the reach of previous studies.3 The old federal peak, in the late 1960s, was just under $10 in today's money.
What economic theory predicts
The textbook prediction is simple. If a wage floor lifts the price of labour above what employers would otherwise pay, they hire fewer hours. How many fewer depends on how sensitive employer demand is to wages, which economists call labour demand elasticity.3
The theory has a second branch. If employers have some power to set wages, because workers cannot easily switch jobs, a higher floor can raise pay with little or no loss of employment, and it can even raise employment.3 Since the 1990s hundreds of empirical studies have tried to decide between these cases. Some find a very small negative effect on jobs, and others find an effect that is difficult to distinguish from zero.3
A further complication is how to count work. The University of Washington team argues that most low-wage jobs are part-time, so counting heads can miss changes in hours. The team therefore measured both headcount and hours worked.2
The decision
The 2014 ordinance: a phased schedule that depends on firm size
The idea came from a mayoral committee. Mayor Ed Murray formed the Income Inequality Advisory Committee in January 2014, and its membership mixed labour and business: the co-chairs were David Rolf of SEIU 775NW and Howard Wright of Seattle Hospitality Group, and members included Ivar's Restaurant, the Seattle Hotel Association, the Seattle Metropolitan Chamber of Commerce and three city councillors.5
It held sector meetings from February 27 to March 13, 2014, and on May 5 presented its framework to the council's select committee. The framework was to raise the city wage to $15, phase it in starting in 2015, index it to consumer prices after $15, grant no exemptions, and recognise that smaller businesses and nonprofits would face particular challenges.5 The slides also posed the central trade-off: how to raise incomes quickly without breaking small employers, and whether tips and health care should count, given Washington's status as one of seven states without a tip credit.5
The city enacted its minimum wage ordinance on June 20, 2014, and the first phase took effect on April 1, 2015.3 The speed of the increase depended on the size of the employer. A large employer, in the Office of Labor Standards' official Q&A (https://www.seattle.gov/documents/departments/laborstandards/mw_qa.pdf), is one with 501 or more employees worldwide, and the definition counts franchisees as large when the franchise network together employs more than 500 people.1
Large employers followed the fastest path. For a large employer that paid nothing towards medical benefits, the wage was $11.00 from April 2015, $13.00 from January 2016, $15.00 from January 2017, $15.45 in 2018, $16.00 in 2019 and $16.39 in 2020.1 The 2018 and later steps reflect annual inflation adjustment once the $15 level was reached.
The statewide floor moved at the same time. Washington's minimum was $9.32 in 2014 and $9.47 in 2015 and 2016. Voters then approved Initiative 1433 in 2016, which set $11.00 for 2017, $11.50 for 2018, $12.00 for 2019 and $13.50 for 2020.6 The gap between Seattle and the rest of the state therefore narrowed after 2016, a point that matters for any comparison with nearby areas.
Small employers had a slower path and a credit for tips and health benefits. Their minimum compensation was $11.00 in April 2015, $12.00 in 2016 and $13.00 in 2017, reaching $15.00 in 2019 and $15.75 in 2020, while the base wage they had to pay in cash was lower, at $10.00 in 2015 and $13.50 in 2020.1
The Berkeley team stresses one design feature. The law introduced a tip credit in a state that had previously had none, and it combined several different rates by employer size, tipping and health insurance.3 That complexity makes any single number for the wage increase misleading.
| Date | Large employer, no medical credit | Large employer, with medical credit | Small employer, minimum compensation |
|---|---|---|---|
| April 1, 2015 | $11.00 | $11.00 | $11.00 |
| January 1, 2016 | $13.00 | $12.50 | $12.00 |
| January 1, 2017 | $15.00 | $13.50 | $13.00 |
| January 1, 2018 | $15.45 | $15.00 | $14.00 |
| January 1, 2019 | $16.00 | $16.00 | $15.00 |
| January 1, 2020 | $16.39 | $16.39 | $15.75 |
- January 2014Mayor Ed Murray forms the Income Inequality Advisory CommitteeSource 7 (opens the source in a new tab)
- June 20, 2014Seattle enacts the minimum wage ordinanceSource 3 (opens the source in a new tab)
- December 2014The city contracts the University of Washington research teamSource 7 (opens the source in a new tab)
- April 1, 2015First phase: wage rises from $9.47 to $10 or $11Source 3 (opens the source in a new tab)
- January 1, 2016Second phase: four rates from $10.50 to $13Source 3 (opens the source in a new tab)
- January 1, 2017Large employers without medical credit reach $15.00Source 1 (opens the source in a new tab)
- June 2017Berkeley and University of Washington reports reach the mayor's office within days of each otherSource 4 (opens the source in a new tab)
- January 1, 2018Large employers reach $15.45 after inflation adjustmentSource 1 (opens the source in a new tab)
- May 2022Published version of the University of Washington paper appears in an economics journalSource 8 (opens the source in a new tab)
The case against: the first firm to cut hours
The strongest objection came from standard economics. A wage floor of $13 to $15 sits far above the range that earlier studies covered. At some level the floor must start cutting into employment, and the question was whether Seattle had reached it. The University of Washington authors found larger effects from the step to $13 than from the step to $11, which they read as a sign that the response is not linear.2
There was also a measurement objection. If employers respond by trimming hours and not by firing workers, studies that count jobs will see nothing. That is why the Seattle team looked at hours worked in jobs paying below a set real wage, across all industries, and not just restaurant headcount.2
Franchise interests opposed the law too. The Berkeley brief notes the opposition of the International Franchise Association, though it reads the larger wage gains at limited-service restaurants as evidence that those firms complied.3
What happened
What the Seattle minimum wage study found: the University of Washington results
The University of Washington paper (https://www.nber.org/system/files/working_papers/w23532/w23532.pdf) used confidential state payroll records that include hours. For all low-wage jobs, defined as paying under $19 an hour, it concluded that the second step, to as much as $13 in 2016, cut hours worked by 6 to 7 percent2, while hourly wages in those jobs rose about 3 percent.2 Because hours fell more than pay rose, total payroll for such jobs fell, which the authors translate into an average loss of $74 a month per job2 in 2016.2
The first step looked different. For the rise from $9.47 to as much as $11, the authors report disemployment effects that approximately offset the wage effects, with elasticity point estimates around -0.9, so total pay for low-wage jobs was roughly unchanged. The second step shifted the balance towards lost hours.2
The headline numbers hide a detail. The study found no employment effect in restaurants at all wage levels, which matches many earlier studies.2 The effect it found came from looking at low-wage jobs in every industry and counting hours. In restaurants, the authors add, point estimates are larger though imprecise when they look only at low-wage jobs and at total hours rather than headcount.2 The first step, to $11, produced smaller effects.
The raw counts show the shape. From the second quarter of 2014 to the second quarter of 2016, the number of Seattle jobs paying less than $13 fell from 38,013 to 25,0532, a drop of 34 percent. Jobs paying under $19 fell only from 90,757 to 89,188, or 1.7 percent, while Seattle's overall employment grew 14.6 percent.2 The authors point out that the fall under $13 could mean workers moved above the threshold, not that jobs vanished.
The same table shows why the authors worry about hours. Average hourly pay in jobs under $19 rose 6.4 percent, from $14.19 to $15.00, but total earnings paid at those wages rose only 2.9 percent, from $517 million to $532 million. Seattle's overall headcount grew 14.6 percent and its hours 15.8 percent, and all of that growth came in jobs paying more than $19 an hour.2 The growth in high-paid work, partly the technology sector, is the backdrop to the whole dispute.
A later paper followed individual workers. Those employed in low-wage jobs just before an increase gained on average $8 to $12 a week in earnings when the floor rose from $9.47 to as much as $13. The gains all went to workers with above-median experience, and roughly a quarter of the gain came from experienced workers making up lost hours with work outside Seattle.9 Job turnover fell 8 percent.
The Berkeley results: pay up, no job loss in food service
The Berkeley team's brief (https://irle.berkeley.edu/wp-content/uploads/2017/06/Seattles-Minimum-Wage-Experiences-2015-16.pdf) looked at food services, an industry that employs many minimum-wage workers, using public county-level payroll data and a synthetic control, a weighted blend of other places built to track Seattle before the law.3 Wages in food services rose, and the estimates fell within the range of earlier credible studies. Wages rose far less at full-service restaurants, which the authors read as use of the tip credit.3
Employment was not affected. The team's estimated wage elasticity for limited-service restaurants was 0.229, while the employment elasticity was -0.060 and not statistically different from zero.3 In plain terms, pay rose, and the estimates show no reliable change in the number of jobs.
Prices and the six-city follow-up
If employers pass costs on, prices should rise. A University of Washington public health team tracked 106 foods in Seattle supermarkets against same-chain stores elsewhere in King County and found no evidence of changes in food prices attributable to two years of the ordinance.10 That covers groceries, not restaurant meals.
In 2019 the Berkeley group extended its method to six cities with wage floors up to $13: Chicago, the District of Columbia, Oakland, San Francisco, San Jose and Seattle. It found significant earnings increases and no significant employment losses in food services, and it proposed that the best explanation was that industry demand for low-wage workers is inelastic.11
What economists still disagree on
Why two Seattle minimum wage studies disagree
The disagreement is not about whether wages rose. It is about which workers, which industries and which controls count. Reich's memo to the mayor's office raised four objections to the University of Washington report. The first was the control group: because the confidential data cover only Washington State, its synthetic Seattle draws from places that, in his words, do not at all resemble Seattle.4
The second was the sample. The University of Washington team excluded multi-site businesses, which Reich says removes 48 percent of Seattle's low-paid workforce4, and he argued that a worker who leaves a one-site business for a chain is counted as a lost job but not as a wage gain. The University of Washington authors state that these businesses employed 29 percent of employees statewide and report survey evidence of no differential response by size.42
The third was the focus on jobs paying under $19, and the fourth was the size of the implied effect. Reich argued the University of Washington estimates of employment effects fell far outside the research range, with labour demand elasticities about -3 against about -0.3 in more credible recent studies.4 The University of Washington paper reports net elasticities of about -0.9 for the step to $11 and about -2.6 for the step to $13.2
Berkeley's own work carries a caveat that it states plainly. Seattle's wages may have diverged from the synthetic comparison just as the law took effect for reasons unrelated to the law, for example because the economy entered a particularly strong boom, and the authors said they could test this only as more quarters of data arrived.3 They also say that none of their employment estimates is precisely measured, which is why they describe them as not significantly different from zero and not as proof of zero.
Reich also read the University of Washington tables differently from their authors. The report shows large estimated falls in restaurant jobs paying under $19 but no effect on restaurant jobs at all pay levels, which he took to mean that pay rose substantially without costing jobs.4 The 2022 journal version offers a different reading of the same pattern: some of the apparent loss reflects workers moving above the wage threshold.8
The two studies differ in four ways that matter for the result.
- Data: the University of Washington used confidential state payroll records with hours, limited to Washington State; Berkeley used public county and city payroll data from across the country.
- Outcome: the University of Washington looked at hours and headcount in all jobs paying under $19; Berkeley looked at pay and employment in food services.
- Sample: the University of Washington excluded multi-site businesses; Berkeley used all establishments in its data.
- Result: the University of Washington found falling hours in low-wage jobs after the step to $13; Berkeley found higher food-service pay and no detectable job loss.
Their findings are not credible and drawing inferences from the report are unwarranted.
— Michael Reich, University of California Berkeley, letter to the Seattle Mayor's Office, June 25, 2017
The University of Washington authors accept limits of their own. They note that the estimates come from a move from the nation's highest state minimum to a higher one, that informal and contract work is not captured, and that some Seattle employers may have moved jobs to the suburbs, in which case the job losses in Seattle overstate losses in the wider labour market.2
The published version softens the headline
The peer-reviewed version appeared in 2022. It reports that part of the fall in low-wage hours reflects jobs moving above the wage threshold, so the aggregate analysis likely overstates employment effects. A longitudinal analysis of individual workers shows no change in the probability of continued employment but significant reductions in hours, especially for less experienced workers.8
The journal version gives aggregate employment elasticities ranging from -0.2 to -2.0, mostly on the intensive margin in the short run, which means hours rather than headcount.8 The range is wide.
Did workers who lost hours at Seattle employers make them up in higher-paying jobs or work outside the city, and would a longer view change the verdict on the second step to $13?
Several limits remain. Berkeley covers food services, not all low-wage work, and the University of Washington data leave out a large slice of multi-site employers. The Seattle boom may have made it easier for workers to find hours elsewhere, which would hide costs in any test run in this city, and the UW authors themselves note that the effects of local policy may differ from a state or national one.2
Lessons
Key takeaways
- Seattle's wage law raised hourly pay in the jobs it reached. Whether total pay rose depends on what happened to hours, and the two research teams disagree.
- Measuring hours as well as headcount changes the picture: the University of Washington found a 6 to 7 percent fall in low-wage hours with no restaurant job loss.
- The choice of comparison group is decisive. A synthetic Seattle built from other parts of Washington State and one built from the whole country gave different answers.
- Later work on individual workers found gains concentrated among experienced workers and lost hours for less experienced ones.
The six-city work also tested for hours responses using California state and local policies, and the authors found no evidence of hours reductions or of employers substituting higher-wage workers.11 That evidence concerns food services in California, not every low-wage job in Seattle.
What carries over is the method debate: any city that raises its floor will face the same questions about hours, comparison groups and multi-site firms. What does not carry over automatically is the size of the effect. Seattle had a hot labour market, a high state minimum and a tech boom, and workers could often find hours in neighbouring suburbs.
Our own caution is that none of these studies tells us what a $15 floor would do in a weaker labour market or a rural area, and all of them end before the full effects of the later inflation-indexed increases could be measured.
Sources
- 1Seattle Office of Labor Standards: Minimum Wage Ordinance Questions and Answers (opens the source in a new tab) · City of Seattle, Office of Labor Standards, 2019 · Primary source · https://www.seattle.gov/documents/departments/laborstandards/mw_qa.pdf
- 2Minimum Wage Increases, Wages, and Low-Wage Employment: Evidence from Seattle (opens the source in a new tab) · National Bureau of Economic Research (Working Paper 23532), 2018 · Paper · https://www.nber.org/system/files/working_papers/w23532/w23532.pdf
- 3Seattle's Minimum Wage Experience 2015-16 (opens the source in a new tab) · UC Berkeley Center on Wage and Employment Dynamics (CWED Policy Brief), 2017 · Paper · https://irle.berkeley.edu/wp-content/uploads/2017/06/Seattles-Minimum-Wage-Experiences-2015-16.pdf
- 4Michael Reich letter to Seattle Mayor's Office (opens the source in a new tab) · UC Berkeley Center on Wage and Employment Dynamics, 2017 · Essay · https://irle.berkeley.edu/publications/brief/reich-letter-txo-seattle-mayors-office/
- 5Income Inequality Advisory Committee: presentation to the Select Committee on the Minimum Wage and Income Inequality (opens the source in a new tab) · City of Seattle, City Clerk, 2014 · Primary source · http://clerk.seattle.gov/~public/meetingrecords/2014/minimum20140505_1a.pdf
- 6History of Washington State's Minimum Wage (opens the source in a new tab) · Washington State Department of Labor & Industries, 2021 · Primary source · https://lni.wa.gov/workers-rights/wages/minimum-wage/history-of-washington-states-minimum-wage
- 7Seattle Minimum Wage Study (opens the source in a new tab) · Evans School of Public Policy and Governance, University of Washington, 2021 · Reporting · https://evans.uw.edu/policy-impact/minimum-wage-study/
- 8Minimum-Wage Increases and Low-Wage Employment: Evidence from Seattle (opens the source in a new tab) · American Economic Journal: Economic Policy 14(2), 2022 · Study · https://www.aeaweb.org/articles?id=10.1257%2Fpol.20180578
- 9Minimum Wage Increases and Individual Employment Trajectories (opens the source in a new tab) · National Bureau of Economic Research (Working Paper 25182), 2018 · Paper · https://www.nber.org/system/files/working_papers/w25182/w25182.pdf
- 10The Impact of a City-Level Minimum Wage Policy on Supermarket Food Prices by Food Quality Metrics: A Two-Year Follow Up Study (opens the source in a new tab) · International Journal of Environmental Research and Public Health, 2019 · Study · https://pmc.ncbi.nlm.nih.gov/articles/PMC6339052/
- 11Are Local Minimum Wages Too High, and How Could We Even Know? (opens the source in a new tab) · UC Berkeley IRLE Working Paper 102-19, 2019 · Paper · https://irle.berkeley.edu/wp-content/uploads/2019/04/Are-Local-Minimum-Wages-Too-High.pdf