- Place
- British Columbia, Canada
- Years
- 2008–2025
- Policy
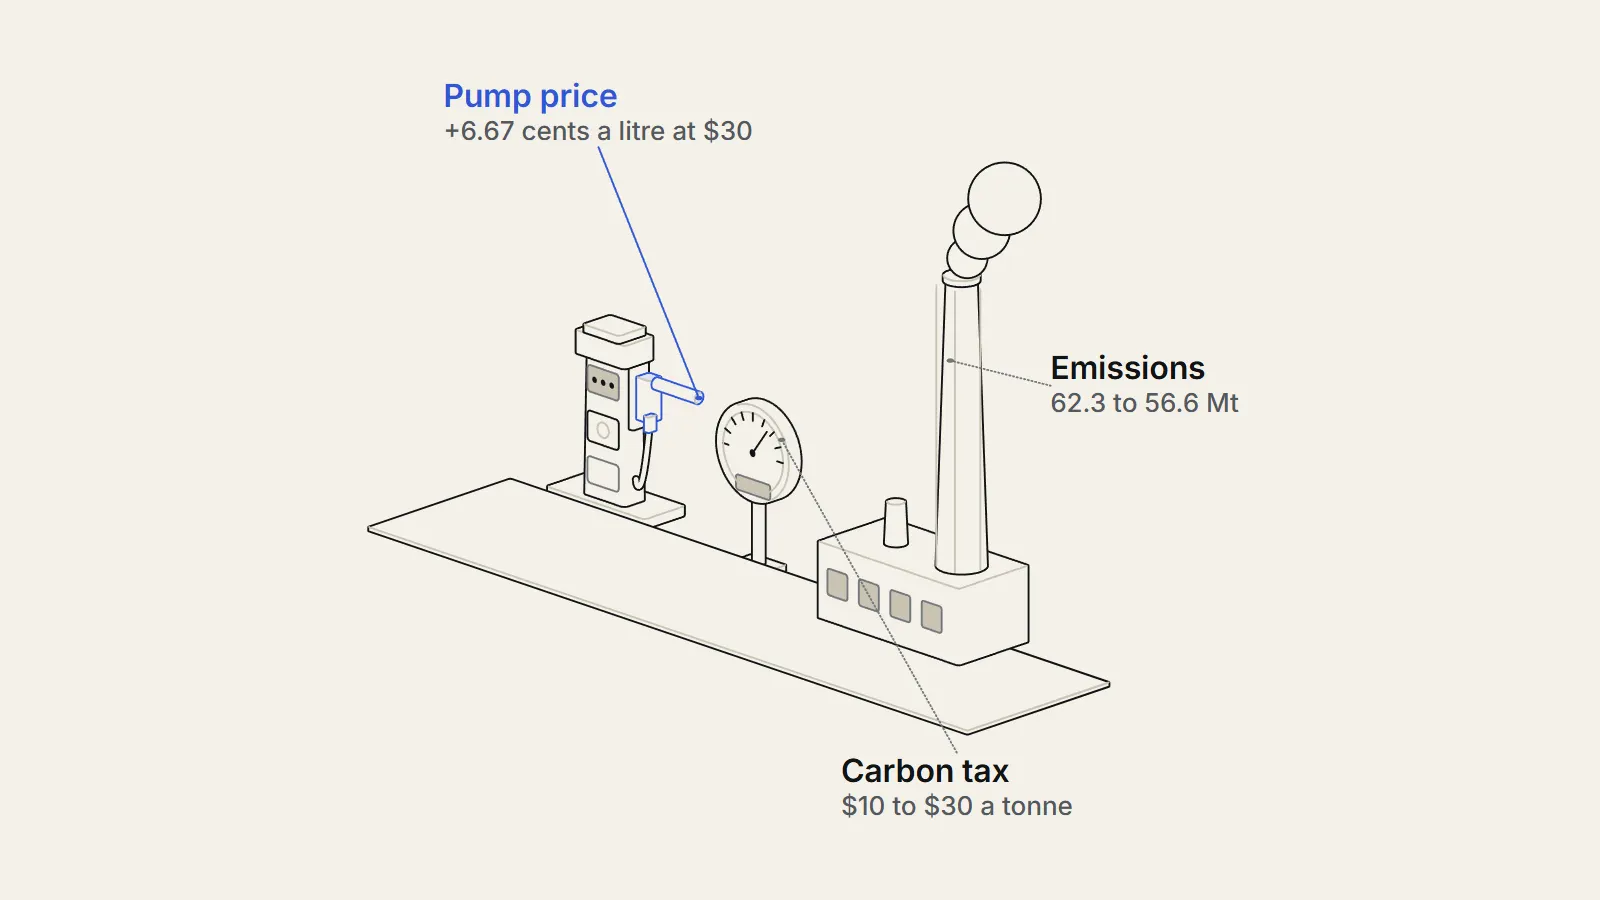
- British Columbia taxed fossil fuels from July 2008, starting at C$10 per tonne and rising to $30 by 2012, with all revenue returned through lower taxes and credits; the consumer tax was set to zero on April 1, 2025.
- Outcome
- Studies estimate emissions fell roughly 5 to 15 percent with negligible effect on the aggregate economy; one 2022 study finds aggregate declines not yet statistically significant. The province repealed the tax in 2025.
The British Columbia carbon tax was North America's first broad carbon tax: it started on July 1, 2008 at C$10 per tonne of carbon dioxide1, rose by $5 a year to $30 in 2012, and returned its revenue through cuts to other taxes.1 Researchers estimate it cut emissions by roughly 5 to 15 percent4, with little harm to the provincial economy, though not every study finds a large aggregate effect.4 The province then set the rate to zero on April 1, 20255.5
Before
This case study follows the British Columbia carbon tax from its surprise announcement to its repeal. We set out how it was designed, what the studies measured, what its critics claimed at the time, and where the evidence is weakest. We take no side on whether it was good policy.
Before 2008: a surprise from the budget speech
The tax came with little warning. The province's Finance Minister revealed it in her February 2008 budget speech, and it surprised the majority of residents. Only in the second half of 2007 had the government begun to hint that pricing pollution was possible.1
British Columbia introduced the first comprehensive carbon tax in North America. By 2012, at $30 per tonne, it covered about three-quarters of the province's greenhouse gas emissions.4
The problem it aimed at was ordinary carbon dioxide from burning fossil fuels. The tax applies to emissions from burning fossil fuels, which accounted for 77 percent of provincial emissions. The rest came from farming and landfills (10 percent), leaks (9 percent) and non-combustion industrial processes (4 percent).1
The logic of a carbon tax is simple. Burning fuel imposes a cost on others that the buyer does not pay, and a tax on the carbon content of the fuel puts that cost into the price, so every household and firm can decide how much to cut and where. The open questions were how big the response would be, who would bear the cost, and whether growth would suffer.
The decision
The 2008 design: a rising tax with every dollar returned
The Carbon Tax Act (https://www.bclaws.gov.bc.ca/civix/document/id/complete/statreg/08040_01) took effect on July 1, 2008. The rate began at C$10 per tonne of carbon dioxide equivalent and rose by $5 every July 1 until it reached $30 in 2012.1 At $10 per tonne the tax added 2.34 cents to a litre of gasoline, and at $30 it added 6.67 cents.1 Gradual steps were meant to limit the cost of adjusting.
The second feature was revenue neutrality. The government promised to return all carbon tax revenue through cuts to personal and corporate taxes and through lump-sum payments. For a household earning $100,000, the average provincial income tax rate fell from 8.74 percent in 2007 to 7.72 percent in 2012. The general corporate rate fell from 12.0 to 10.0 percent, and the small business rate from 4.5 to 2.5 percent.1
Targeting mattered. A low-income climate action tax credit paid $115.50 per adult and $34.50 per child, about $300 for a low-income family of four, the tax rates in the two lowest personal brackets were cut by five percentage points, and in the first year every resident received a one-time $100 dividend.2 From 2011 northern and rural homeowners received a further benefit of up to $200.1
| Offset | Detail |
|---|---|
| Low-income climate action tax credit | $115.50 per adult and $34.50 per child; about $300 for a low-income family of four |
| Personal income tax | Rates in the lowest two brackets cut by five percentage points |
| One-time dividend | $100 for every resident in the first year |
| Corporate and small business tax | General corporate rate 12.0 to 10.0 percent; small business rate 4.5 to 2.5 percent, 2007 to 2012 |
| Rural and northern homeowners | Further benefit of up to $200 from 2011 |
The tax was not small in revenue terms. By Metcalf's account it collected over $1 billion annually, more than five percent of provincial tax collections, and added roughly one-fifth to the overall excise tax on gasoline.2 The Carbon Tax Act is the legal base, and its gasoline rate schedule later set the repeal.6
- February 2008The Finance Minister announces the revenue-neutral carbon tax in her budget speechSource 1 (opens the source in a new tab)
- July 1, 2008Tax takes effect at C$10 per tonne of CO2 equivalentSource 1 (opens the source in a new tab)
- July 1, 2009Rate rises to $15 per tonneSource 1 (opens the source in a new tab)
- July 1, 2010Rate rises to $20 per tonneSource 1 (opens the source in a new tab)
- July 1, 2011Rate rises to $25 per tonneSource 1 (opens the source in a new tab)
- July 1, 2012Rate reaches $30 per tonneSource 1 (opens the source in a new tab)
- 2018Rate stands at C$35 per tonne, scheduled to rise $5 a year to $50 in 2021Source 2 (opens the source in a new tab)
- April 2019Federal rules, as described in 2019, require every province to price carbon; British Columbia's own tax countsSource 2 (opens the source in a new tab)
- March 31, 2025Government introduces legislation to cut the consumer carbon tax to zeroSource 5 (opens the source in a new tab)
- April 1, 2025Gasoline carbon tax rate falls from 17.61 cents per litre to zeroSource 6 (opens the source in a new tab)
The case against the carbon tax at the time
The tax was opposed from the start. By June 2008 the opposition New Democratic Party was running an Axe the Tax campaign. It said the tax was regressive, poorly designed and hurt public services, and also that it had little or no effect on climate change and was mainly symbolic.7
The NDP environment critic's email, quoted by Marc Lee, cited school districts that expected extra costs, though Lee noted in the comments that the Burnaby figure was about 0.6 percent of that board's budget. Burnaby schools estimated the carbon tax would cost them $1.2 million and Surrey council over $2 million.7 Its policy position was that emission pricing should be a tax at source aimed at large polluters, with consumers protected from paying twice.
The criticism came from inside the climate camp too. Marc Lee, an economist who supports a hybrid pricing system, answered that the NDP's two claims contradict each other, since a tax cannot be both a severe burden and merely symbolic. He added that the NDP itself endorsed emission pricing, and that all fossil fuels burned in the province were taxed, with gaps mainly for process emissions from cement and aluminum and for leaks from landfills and pipelines.7
Later evidence gave the geographic worry some support. In the Lawley and Thivierge household study, city residents cut their gasoline use while those in small towns and rural areas did not, which suggests that people with fewer alternatives paid the tax without changing behaviour.8
Later research raised a second set of concerns about industry. Murray and Rivers note that some emissions-intensive sectors face challenges under the tax.4 And a study of employment cited by Metcalf found the largest job loss in chemical manufacturing and the largest gain in health care, so jobs shifted rather than vanished.2
What happened
What happened to British Columbia carbon tax emissions and the economy
Two methods recur below. Difference-in-differences compares the change in British Columbia before and after 2008 with the change in provinces without the tax. Synthetic control builds a weighted blend of other provinces that tracked British Columbia closely before the tax, then asks whether British Columbia departed from that blend afterwards.
Measuring the effect is hard because British Columbia is a single province during a global recession. Researchers compare it with other provinces, or model what would have happened. A review of the early evidence, by Brian Murray and Nicholas Rivers, concludes the tax reduced emissions by between 5 and 15 percent, based on empirical and simulation models.4
Gilbert Metcalf of Tufts University, in a paper for the Brookings Institution (https://www.brookings.edu/wp-content/uploads/2019/03/On-the-Economics-of-a-Carbon-Tax-for-the-United-States.pdf), ran regressions across Canadian provinces for 1990 to 2016. Including all provinces, he found a treatment effect of -3.6 percent, imprecisely estimated. Dropping Alberta, Quebec and Ontario, which had their own carbon policies or renewable programs, the effect was -6.6 percent2, and at a tax of $30 per tonne he estimated emissions fell 7.8 percent. He summarised the results as a 5 to 8 percent reduction since 2008.2
Gasoline is where the response is clearest. Nicholas Rivers and Brandon Schaufele found that the carbon tax cut gasoline demand by more than an equal rise in the market price would have, which they attribute to the tax being more visible.9 They estimate about 2.4 million tonnes less carbon dioxide from gasoline over the first four years, down from the more than 3.5 million tonnes in their 2013 working paper.1
Two alternative explanations were tested. One is cross-border shopping, with drivers filling up in Alberta or Washington State. The authors cannot dismiss it entirely but find it implausible, since both places already had lower gasoline prices before the tax and over 95 percent of residents would have to drive more than two hours to reach Alberta. The other is vehicle programs: the province's SCRAP-IT retirement scheme covered about 18,000 vehicles, less than 1 percent of the more than 2 million passenger vehicles registered in the province.1
Household data point the same way. Chad Lawley and Vincent Thivierge, controlling for transit improvements and cross-border shopping, found that a 5 cent per litre carbon tax reduced household gasoline consumption by 8 percent, and by 5 percent on their most conservative estimate. Households in Vancouver and other cities responded, while those in small towns and rural areas did not.8
The aggregate picture is less clear. Felix Pretis used difference-in-differences, synthetic control and a break-detection method and found the tax reduced transportation emissions, while aggregate CO2 declines are not yet statistically significant10.10 He concluded that current carbon prices may be too low to be effective so far.
too low to be effective
— Felix Pretis, University of Victoria, on carbon prices in British Columbia, Environmental and Resource Economics, 2022
The same early evidence produced a fiscal surprise. The 2013 working paper reports that the tax would collect $510 million less than expected over its first four years, a 16.7 percent shortfall, which the authors read as a larger demand response than the government anticipated.1
Growth, jobs and who paid
On growth, Metcalf's estimates range widely. Without controls for the mix of industries the effect on provincial GDP is small and negative at -0.22 percent and imprecise. With controls, and with Alberta, Quebec and Ontario excluded, it turns positive, at 9.2 percent for 1990 to 2016, which is significant at the 10 percent level. He cautions that the estimates are imprecise and that readers should not lean too heavily on them, though he judges it fair to say GDP has not been adversely affected.2
On jobs, a study cited by Metcalf found a modest but statistically significant aggregate gain of about three-quarters of a percent annually.2 On fairness, Beck and co-authors used an economy-wide model with households sorted into income deciles. They found the tax progressive even before the revenue was recycled, and the recycling scheme progressive as well, because welfare effects depend more on the source of a household's income than on its spending.11
The 2025 repeal
On March 31, 2025 the province, in a government news release (https://news.gov.bc.ca/releases/2025FIN0014-000280), introduced legislation to cut the consumer carbon tax to zero from April 1, which removed about 17 cents per litre from fuel and about 15 cents per cubic metre from natural gas. It also cancelled the climate action tax credit, and the move aligned the provincial rate with the new federal rate.5 Large emitters remain under the province's output-based pricing system, and Energy and Climate Solutions Minister Adrian Dix pointed to heat pump rebates and energy-efficiency upgrades as continuing climate measures.5
The government gave its reasons. Finance Minister Brenda Bailey said the tax had become too politically divisive, and Premier David Eby said people should not have to choose between climate action and affording their bills.5 The government put the first-year fiscal impact of cancelling both the tax and the credit at $1.99 billion and estimated that the average family would have paid about $410 in 2025-26.
too politically divisive
— Brenda Bailey, B.C. Finance Minister, on the consumer carbon tax, March 31, 2025
The Carbon Tax Act's rate schedule shows the change in the law. For the year starting April 1, 2024, gasoline carried 17.61 cents per litre of carbon tax and natural gas 15.25 cents per cubic metre. From April 1, 2025, every fuel in the schedule carries a rate of zero.6
What economists still disagree on
What the data can and cannot show about the carbon tax
The studies disagree less about direction than about size. Metcalf's 5 to 8 percent rests on comparing British Columbia with provinces that were changing in their own ways, and the 5 to 15 percent range also draws on simulation models. Pretis's conclusion rests on a different test, one that asks whether a break shows up in total emissions, and it does not find a large one.210
Two features of the case make clean answers hard. The tax started as the economy entered a recession, which cut fuel use everywhere. And the comparison provinces were not static, since Alberta put a price on industrial emissions in 2007, Quebec began a modest cap-and-trade in 2013, and Ontario enacted a generous feed-in tariff for renewable energy in 2009.2
Pretis argues that emission reductions in provinces without a carbon tax came from plant closures and efficiency gains in emission-intensive industries.10 That means a drop in a comparison province can look like a failure of the tax, when it was unrelated to carbon prices. The reverse also applies. A change in British Columbia may have causes other than the tax.
The official numbers add little help. The national inventory shows British Columbia's emissions at 62.3 million tonnes in 2005 and 56.6 million in 2024, a 9 percent fall, against a rise of about 3.5 percent in Alberta (our calculation from the same table) and falls of 22 percent in Ontario and 9 percent in Quebec.3 Those totals are not an estimate of the tax's effect, since many policies and economic shocks sit behind them.
External validity is a further limit. Metcalf notes that British Columbia is a moderately large source of carbon dioxide in Canada but a small emitter per person and per dollar of GDP, and that three of the four provinces with carbon pricing have very low emissions per capita or low emissions intensity. Alberta, a top emitter on nearly every measure, is the reverse.2 A tax that works in a low-carbon province may do less in a high-carbon one.
Public opinion moved too. Murray and Rivers report that polling showed the public initially opposed the tax but, about three years after it started, generally supported it.4 That later support did not prevent its removal in 2025.
Several kinds of evidence would narrow the disagreement, and the studies we opened point to what is missing.
- Sector-by-sector emissions, so that transport, buildings and industry can be separated, since Pretis finds an effect only in transport.
- Comparison provinces whose own policies are cleanly separated from the tax, which Metcalf handles by dropping Alberta, Quebec and Ontario.
- Evidence on how rural households and emissions-intensive industries adjusted, since the household study finds no response outside the cities.
- A longer run of data at a higher price, which the 2025 repeal now makes impossible to collect in British Columbia.
Would a higher tax have produced a larger and more visible cut in total emissions, or do other policies, such as industrial regulation, do more of the work?
The question of revenue neutrality is also argued. The tax was designed to return every dollar, and Metcalf describes revenue returned through lower tax rates, grants and credits.2 The 2013 working paper adds that early revenue came in below forecast. We could not open the competing accounts of whether the package stayed neutral in later years, so we do not rely on them here.
A last disagreement is political and cannot be settled with data. The tax faced a campaign against it in 2008, was raised to $35 by 2018, and was set to zero in 2025 to align with the federal rate. The record shows a policy can run as designed for years while remaining politically fragile.
Lessons
Key takeaways
- A revenue-neutral carbon tax can be introduced without visible damage to growth: reviews found negligible effects on the aggregate economy, though some emissions-intensive sectors struggled.
- The measured emissions effect is modest and uneven: roughly 5 to 15 percent in reviews, clearest in transport fuels, and not yet statistically clear in aggregate emissions in one 2022 study.
- Design shaped the distribution. In one economy-wide model the tax was progressive even before revenue was returned, and the revenue recycling scheme was progressive as well.
- Political durability was the weakest point. The tax that withstood a 2008 campaign was set to zero in 2025.
What carries over is the design: gradual steps, announced increases and visible returns of revenue. What does not carry over automatically is the size of the effect. British Columbia is a province with relatively low emissions per person, so a tax on fuel does not cover the same ground it would in a coal-heavy economy.
Our own caution is that none of these studies can tell us what the tax would have done at a much higher price, and that the repeal means the long-run answer will never be observed in British Columbia.
Sources
- 1Salience of Carbon Taxes in the Gasoline Market (working paper) (opens the source in a new tab) · University of Ottawa (working paper, June 2013), 2013 · Paper · https://www.ivey.uwo.ca/media/1361416/salience-of-carbon-taxes.pdf
- 2On the Economics of a Carbon Tax for the United States (opens the source in a new tab) · Brookings Papers on Economic Activity (conference draft), 2019 · Paper · https://www.brookings.edu/wp-content/uploads/2019/03/On-the-Economics-of-a-Carbon-Tax-for-the-United-States.pdf
- 3Greenhouse gas emissions (Canadian Environmental Sustainability Indicators) (opens the source in a new tab) · Environment and Climate Change Canada, 2026 · Primary source · https://www.canada.ca/en/environment-climate-change/services/environmental-indicators/greenhouse-gas-emissions.html
- 4British Columbia's revenue-neutral carbon tax: A review of the latest grand experiment in environmental policy (opens the source in a new tab) · Energy Policy 86, 2015 · Study · https://ideas.repec.org/a/eee/enepol/v86y2015icp674-683.html
- 5B.C. eliminates carbon tax (news release) (opens the source in a new tab) · Government of British Columbia, Ministry of Finance, 2025 · Primary source · https://news.gov.bc.ca/releases/2025FIN0014-000280
- 6Carbon Tax Act [SBC 2008] c. 40 (consolidated), Schedule 1 (opens the source in a new tab) · Government of British Columbia, BC Laws, 2025 · Law · https://www.bclaws.gov.bc.ca/civix/document/id/complete/statreg/08040_01
- 7The BC NDP's Axe-The-Tax Campaign (opens the source in a new tab) · Progressive Economics Forum, 2008 · Essay · https://www.progressive-economics.ca/2008/06/the-bc-ndps-axe-the-tax-campaign/
- 8Refining the evidence: British Columbia's carbon tax and household gasoline consumption (opens the source in a new tab) · The Energy Journal 39(2), 2018 · Study · https://crdcn.ca/publication/refining-the-evidence-british-columbias-carbon-tax-and-household-gasoline-consumption/
- 9Salience of carbon taxes in the gasoline market (opens the source in a new tab) · Journal of Environmental Economics and Management 74, 2015 · Study · https://econpapers.repec.org/RePEc:eee:jeeman:v:74:y:2015:i:c:p:23-36
- 10Does a Carbon Tax Reduce CO2 Emissions? Evidence from British Columbia (opens the source in a new tab) · Environmental and Resource Economics 83(1), 2022 · Study · https://ideas.repec.org/a/kap/enreec/v83y2022i1d10.1007_s10640-022-00679-w.html
- 11Carbon tax and revenue recycling: Impacts on households in British Columbia (opens the source in a new tab) · Resource and Energy Economics 41, 2015 · Study · https://ideas.repec.org/a/eee/resene/v41y2015icp40-69.html