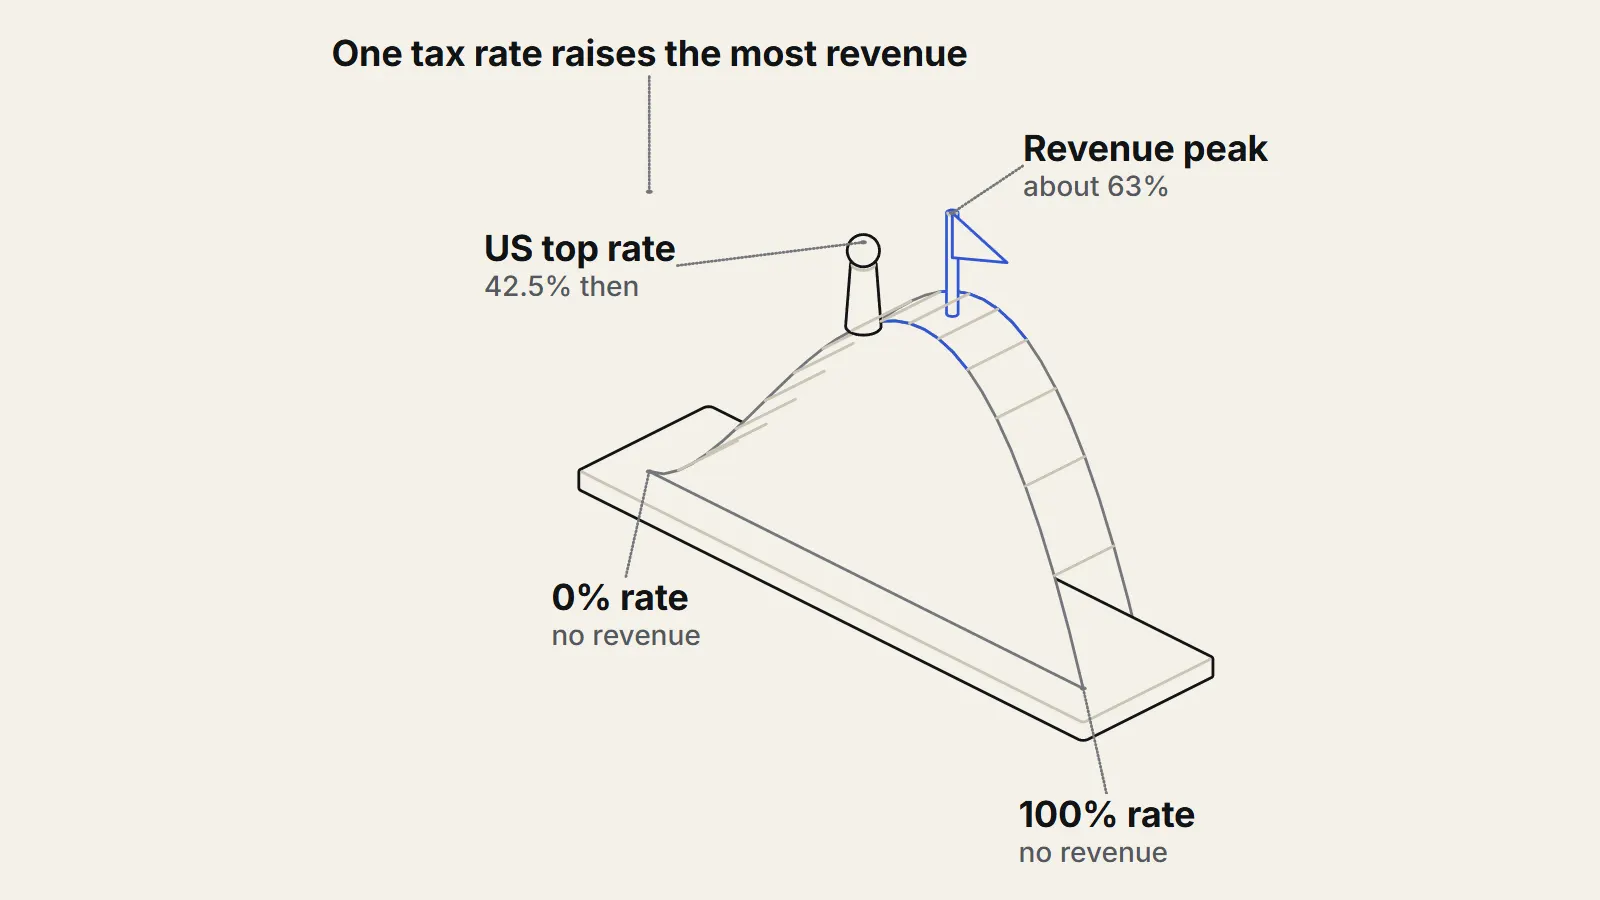
The Laffer curve says that a tax raises no revenue at a 0 percent rate and, in theory, none at a 100 percent rate, so somewhere in between there is a rate that raises the most. That is all it claims. It does not say where the peak is, and it does not say that cutting taxes pays for itself. Whether a given country is above or below the peak is an empirical question. Studies that try to answer it for the United States tend to put the revenue-maximizing rate on labor income well above today's rates, and find that tax cuts recover only a fraction of their cost.
What does the Laffer curve actually say?
Picture a hill. On the left, a rate of zero collects nothing. On the right, a rate so high that nobody bothers to earn or report income also collects nothing. Between the two sits a peak. If a government is to the left of the peak, raising the rate raises revenue, though by less than a simple calculation suggests because people respond. If it is to the right, a cut would raise revenue. Economists call the second case the slippery side of the curve.
The key point is that the curve is a shape, not a measurement. Its peak depends on how strongly people change their work, saving and reporting when taxes change, and on which tax is being raised. Different taxes have different curves.
Where do countries sit on the Laffer curve?
One widely discussed modern estimate comes from economists Mathias Trabandt and Harald Uhlig, who built a model of the economy and calibrated it to tax rates in the United States and 14 European Union countries. In their benchmark, the US could raise 30 percent more revenue1 by raising labor taxes, and 6 percent more by raising capital income taxes. For the EU-14 the numbers were 8 and 1 percent.1 The labor tax rate that maximizes revenue in the US model is about 63 percent, so the US sits to the left of the peak for labor taxes in that benchmark. A version of the model with endogenous growth and human capital instead puts the US and EU-14 close to the peak. Those results are in the NBER working paper (https://www.nber.org/papers/w15343).
The same paper finds that the US and the EU-14 are also on the left side of the capital tax curve, with little room to raise revenue, while countries such as Denmark and Sweden are on the slippery side, where cutting capital taxes would improve their budgets. A cut in capital taxes in their model recovers a large share of its cost, mainly through higher labor tax receipts. The authors also find that consumption taxes have no peak at all in their model, because revenue keeps rising as the rate rises.
Do tax cuts pay for themselves?
Usually not entirely. Trabandt and Uhlig estimate that in the US model 32 percent of a labor tax cut1 and 51 percent of a capital tax cut are self-financing in the long run, meaning that much of the lost revenue returns through extra work, saving and investment.1 An earlier approach by economists Gregory Mankiw and Matthew Weinzierl reached a similar conclusion for capital: with standard parameters, half of a capital tax cut2 is self-financing, while the NBER summary puts the labor figure near 17 percent.2 Their working paper (https://www.nber.org/papers/w11000) describes the feedback as surprisingly large, yet it is far short of the full cost.
These are long-run, model-based numbers. Short-run effects can differ, and the transition matters. Trabandt and Uhlig note that a permanent surprise increase in capital taxes always raises revenue in the short run in their setting. So the question is rarely whether a cut pays for itself, but how much of it does, over what time, and for which tax.
How is the curve misused?
There are two common mistakes. The first is to treat the curve as proof that a particular cut will raise revenue. It will only do so if the economy is on the slippery side for that tax, and the estimates above suggest the US is not on that side for labor taxes. The second is to treat revenue as the goal. Trabandt and Uhlig stress that maximizing tax revenue is quite different from maximizing welfare, since higher taxes can bring larger efficiency losses, and also that the value of what the government buys with the money matters.1
The same logic is used in the other direction too. Economists Peter Diamond and Emmanuel Saez applied a related formula to top earners. The revenue-maximizing top rate equals 1 divided by one plus the product of a measure of how thin the top of the income distribution is and the elasticity of top incomes to the net-of-tax rate. With the first set at 1.5 and the second at 0.25, a mid-range estimate from the literature, the result is 73 percent3, against a then-current top US marginal rate of 42.5 percent when all taxes are combined.3 The calculation is in their public working paper (https://eml.berkeley.edu/~saez/diamond-saezJEP11opttax.pdf). The figure depends entirely on the two inputs, and the authors say the rate would be lower if more weight were put on top earners' own consumption.
What is disputed, and what is not known?
A broad review of the evidence adds a check from the other side. Economists Emmanuel Saez, Joel Slemrod and Seth Giertz surveyed studies of how taxable income responds to tax rates. They concluded that there are no truly convincing estimates of the long-run response, that the best available estimates range from 0.12 to 0.40, and that even at the top of that range the US top marginal rate is far from the top of the Laffer curve.4 They also report that behavioral responses at the top come mainly through timing and avoidance, not real changes in work, so the better policy response to large responses may be to broaden the tax base rather than lower rates. The survey is in the Journal of Economic Literature (https://www.aeaweb.org/articles?id=10.1257%2Fjel.50.1.3).
The elasticity of high earners is estimated, not observed, and studies disagree. The effect of a tax change depends on the design of the tax, such as the base and the loopholes, and on how the government spends what it collects. The models above assume particular behavior from households and do not capture every channel, from migration to the timing of income. Finally, the peak is not a target. A government could rationally choose a rate below the revenue-maximizing one, and many do.
Key takeaways
- The Laffer curve says only that some rate between 0 and 100 percent raises the most revenue; it does not locate the peak.
- A well-known model finds the US on the left side of the peak for labor taxes, with the peak near 63 percent, so in that model a labor tax cut would not pay for itself.
- Model estimates put the self-financing share of a US labor tax cut at roughly 17 to 32 percent, and of a capital tax cut at roughly 50 percent.
- The revenue-maximizing top rate depends heavily on how much high earners change their behavior, which is uncertain.
- The peak is a revenue target, not a welfare target, so it is not the same as the best tax rate.
Sources
- 1How Far Are We From The Slippery Slope? The Laffer Curve Revisited (opens the source in a new tab) · NBER Working Paper 15343 (published in Journal of Monetary Economics 58(4), 2011), 2011 · Paper · https://www.nber.org/papers/w15343
- 2Dynamic Scoring: A Back-of-the-Envelope Guide (opens the source in a new tab) · NBER Working Paper 11000 (Journal of Public Economics 90, 2006), 2006 · Paper · https://www.nber.org/papers/w11000
- 3The Case for a Progressive Tax: From Basic Research to Policy Recommendations (opens the source in a new tab) · Journal of Economic Perspectives 25(4); CESifo WP 3548, 2011 · Paper · https://eml.berkeley.edu/~saez/diamond-saezJEP11opttax.pdf
- 4The Elasticity of Taxable Income with Respect to Marginal Tax Rates: A Critical Review (opens the source in a new tab) · Journal of Economic Literature 50(1), 2012 · Paper · https://www.aeaweb.org/articles?id=10.1257%2Fjel.50.1.3