Where you’ve heard it
“Stocks always go down faster than they go up, but they always go up more than they go down.” — David Gardner, co-founder of The Motley Fool, quoted in a Motley Fool staff article, 6 June 2016 (podcast recorded 23 March 2016). Read the article (https://www.fool.com/investing/2016/06/06/great-quotes-stocks-go-down-faster-than-they-go-up.aspx). The line is a version of the common claim, not a word-for-word statement of it.
Stocks always go down faster than they go up, but they always go up more than they go down.
Why people believe it
What the evidence shows
The case for the claim starts with a large body of data. The UBS Global Investment Returns Yearbook, built on work by finance professors Elroy Dimson, Paul Marsh and Mike Staunton, finds that US shares returned 6.6 percent a year after inflation from 1900 to 2025, compared with 1.6 percent for bonds1.1 It also reports that equities were the best performing asset class in all 21 Yearbook countries with continuous investment histories. See the 2026 public summary (https://www.ubs.com/content/dam/assets/wm/static/cio/documents/giry2026-summary-public.pdf).
Two limits sit inside that sentence. First, “continuous investment histories” leaves out markets that were closed or wiped out, so the countries counted are, in part, those whose markets survived. A sample picked after the fact tends to flatter returns, a point the authors of a separate 16-country study also warn about when they construct their indices.2 Second, “best asset class” describes averages over more than a century, not a promise for any 10 or 20 year stretch.
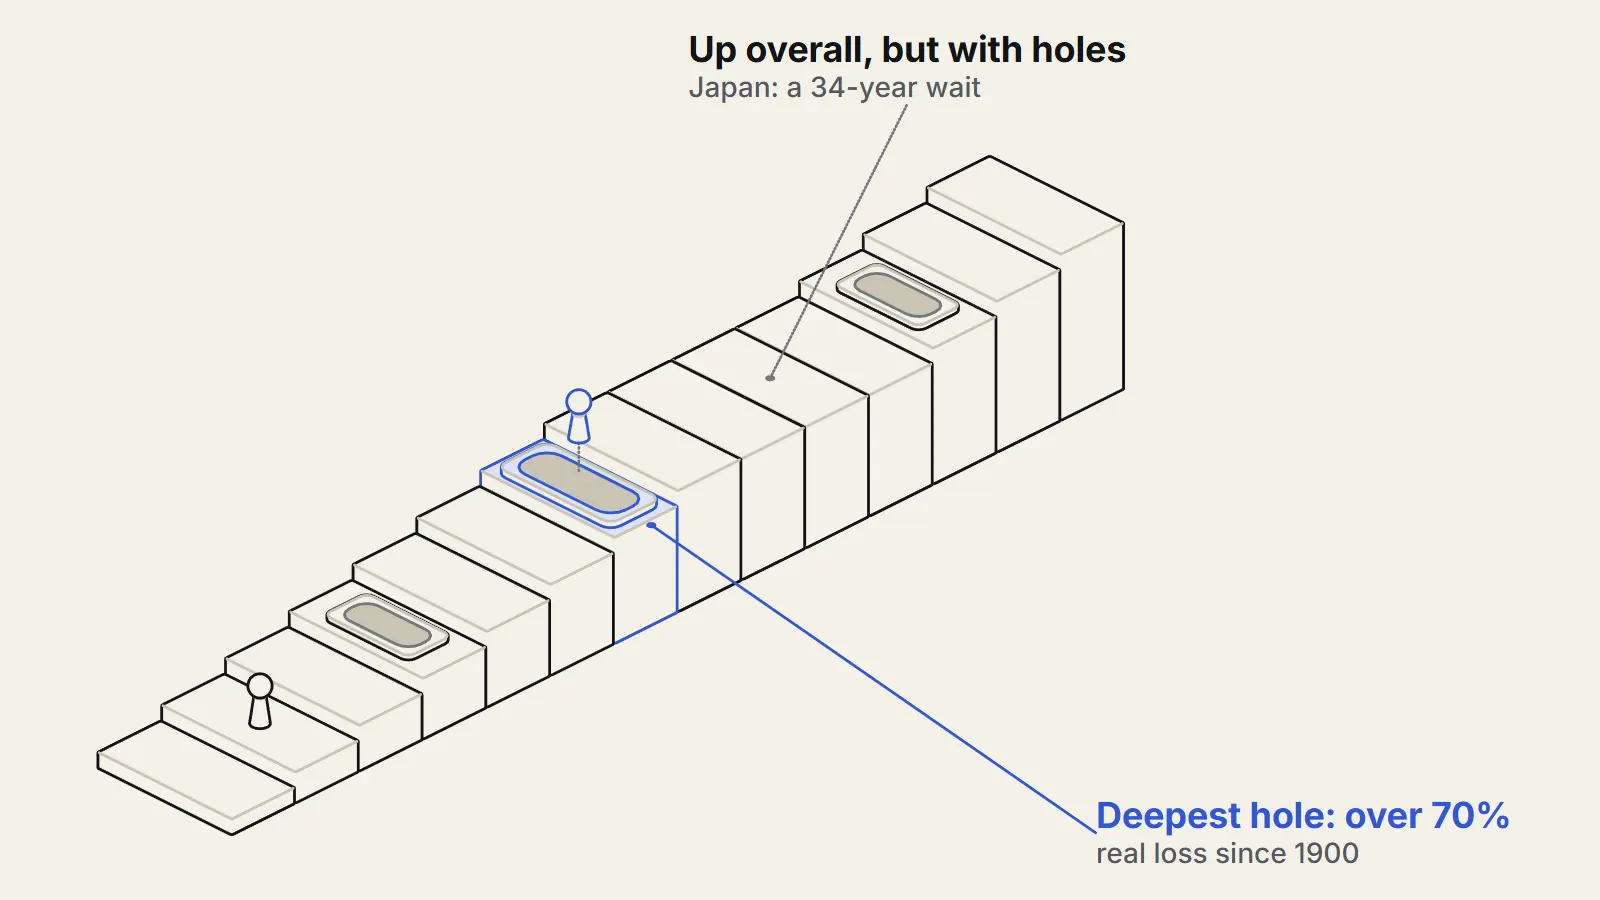
How rough can the ride be? The Yearbook says that, since 1900, equities and bonds have on several occasions lost more than 70 percent in real terms1.1 The 16-country study finds that average real returns on shares, measured over decade-long windows, were as high as 16 percent and as low as minus 4 percent a year.2 Even a long holding period has contained a decade in which investors lost ground after inflation.
Japan shows the longest wait in a major market. The Nikkei 225 closed at 38,915.87 on 29 December 1989 and did not close above that level until 22 February 2024, when it ended at 39,098.68, 34 years and 2 months later3.3 The Nikkei is an index of share prices, so the figure leaves out dividends received along the way, and it does not adjust for inflation. A buyer who held the whole market and reinvested payouts would have done better than the price index alone suggests, but the point remains: the recovery in price took more than three decades. Details are in this nippon.com data note (https://www.nippon.com/en/japan-data/h01927/).
What is not known: nobody knows whether the next century will repeat the record of the last one, and the countries with the best records were, in part, those that avoided wars, revolutions and closed markets. The data cannot tell a reader how long they will have to wait, or whether a given market belongs with the winners.
The better question
A better question: over the number of years the money is actually needed, and with a spread of holdings, how large and how long have the worst losses been, and what happened to those who had to sell during them?
Sources
- 1UBS Global Investment Returns Yearbook 2026, public summary edition (opens the source in a new tab) · UBS and London Business School / Cambridge Judge Business School, 2026 · Report · https://www.ubs.com/content/dam/assets/wm/static/cio/documents/giry2026-summary-public.pdf
- 2The Rate of Return on Everything, 1870-2015 (opens the source in a new tab) · Federal Reserve Bank of San Francisco Working Paper 2017-25, 2017 · Paper · https://www.frbsf.org/wp-content/uploads/wp2017-25.pdf
- 3Nikkei Index Sets First Record High Since 1989 (opens the source in a new tab) · nippon.com, 2024 · Reporting · https://www.nippon.com/en/japan-data/h01927/