Where you’ve heard it
“the great majority of managers who attempt to over-perform will fail.” Warren Buffett, in his Berkshire Hathaway shareholder letter dated February 25, 2017. Read the letter (https://www.berkshirehathaway.com/letters/2016ltr.pdf)
“79% of all active large-cap U.S. equity funds underperformed the S&P 500” InvestmentNews, March 4, 2026, reporting on the S&P SPIVA scorecard. Read the article (https://www.investmentnews.com/equities/active-managers-stumble-again-in-2025-as-large-caps-dominate/265541)
the great majority of managers who attempt to over-perform will fail.
79% of all active large-cap U.S. equity funds underperformed the S&P 500
Why people believe it
What the evidence shows
The best-known yardstick is the SPIVA U.S. Scorecard from S&P Dow Jones Indices. Its design answers two common objections. It counts every fund alive at the start of a period, so funds that were shut down or merged away still count against the group, and it compares each category with a matching benchmark, with returns measured after fees.1
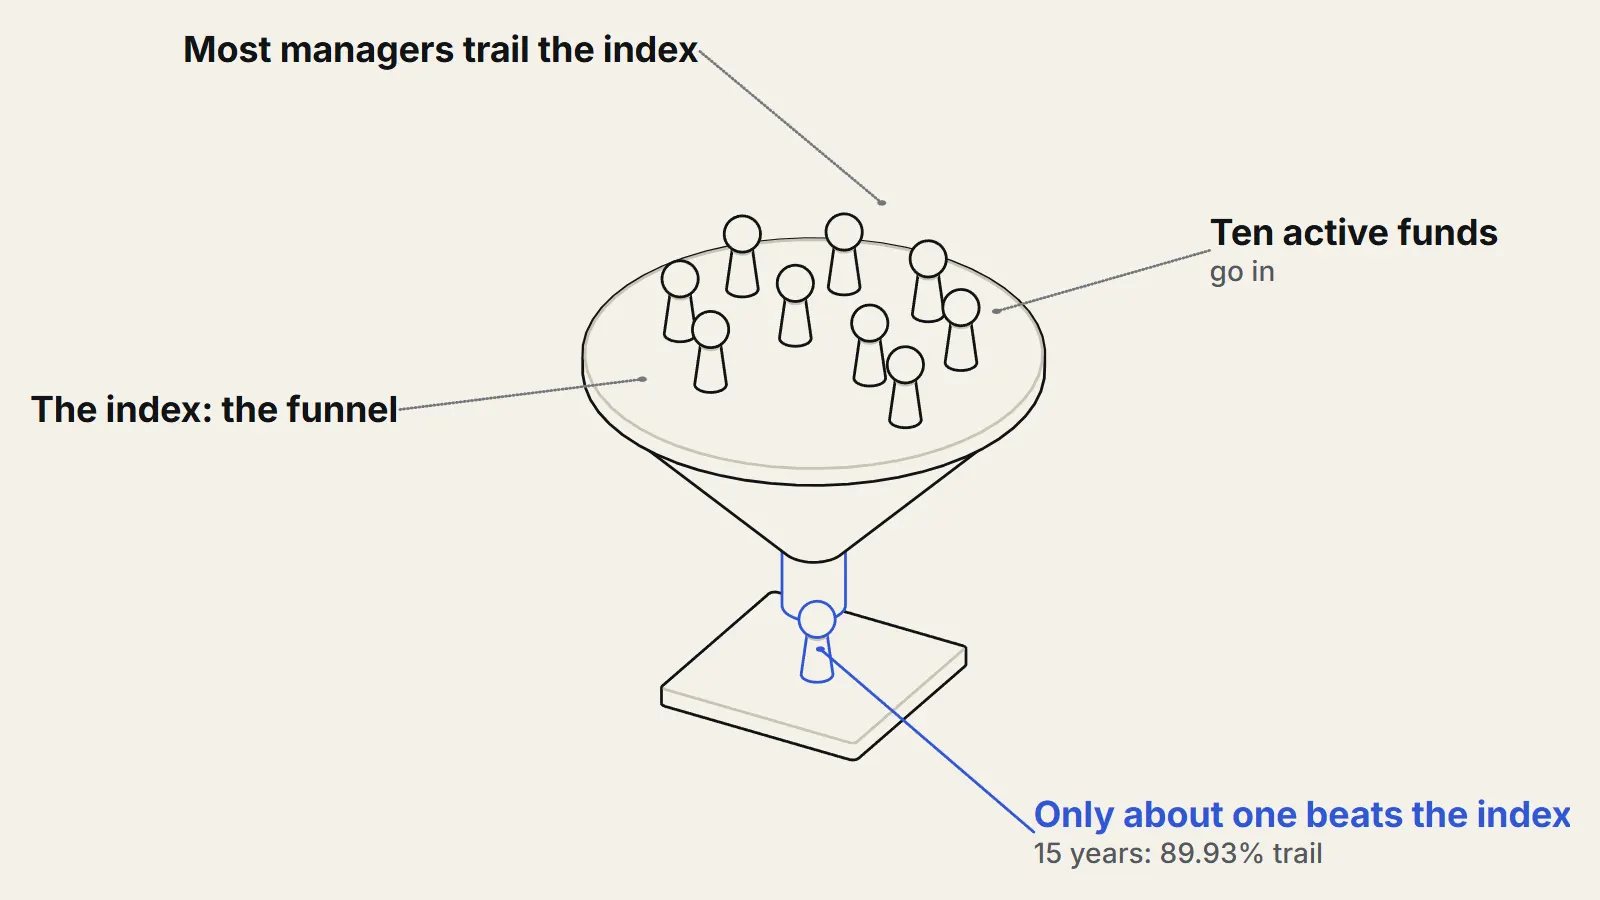
In the year-end 2025 edition, 89.93 percent of all large-cap funds underperformed the S&P 500 over 15 years1, and 92.89 percent over 20 years.1 The table shows the share of funds trailing their benchmark by period and size group.
| Fund group | 1 year | 3 years | 5 years | 10 years | 15 years | 20 years |
|---|---|---|---|---|---|---|
| All domestic funds | 79.83 | 80.40 | 91.47 | 90.43 | 93.15 | 95.01 |
| Large-cap | 78.78 | 66.84 | 88.96 | 85.59 | 89.93 | 92.89 |
| Mid-cap | 55.41 | 62.93 | 72.32 | 81.14 | 84.49 | 89.74 |
| Small-cap | 40.65 | 42.18 | 62.67 | 75.95 | 89.90 | 90.28 |
The pattern is not uniform. In 2025, 79 percent of active large-cap funds trailed the S&P 5001, up from 65 percent in 2024 and the fourth-worst year in the scorecard’s 25-year history. Over a single year, though, only 40.65 percent of small-cap funds trailed their benchmark, so most of them beat it.1 The average also depends on how it is weighted. Weighted by assets, large-cap funds returned 18.03 percent in 2025 against 17.88 percent for the index, a slight win. Over 15 years the asset-weighted figure was 12.75 percent a year against 14.06 percent, and the equal-weighted figure was 11.28 percent.1
Academic work points the same way for fees. Fama and French found that few funds produce benchmark-adjusted expected returns sufficient to cover their costs2. They also found that if fees are added back, some funds show evidence of superior performance in the extreme tail of the distribution, and some of inferior performance, so skill is not ruled out.2
Two limits apply. The scorecard measures funds in set categories over fixed periods, not what any one investor experienced, and this check did not test whether past winners repeat. “Cannot” claims more than the data show; “most do not, over long periods, after fees” is what the data support. This is an explanation of evidence, not advice.
The better question
After fees and over a full market cycle, which funds beat a matching index, and can anyone identify them in advance?
Sources
- 1SPIVA U.S. Scorecard, Year-End 2025 (opens the source in a new tab) · S&P Dow Jones Indices, 2026 · Report · https://www.ariesadvisors.com/files/spiva-us-year-end-2025.pdf
- 2Luck versus Skill in the Cross-Section of Mutual Fund Returns (opens the source in a new tab) · The Journal of Finance, vol. 65, no. 5, 2010 · Paper · https://mba.tuck.dartmouth.edu/bespeneckbo/default/AFA611-Eckbo%20web%20site/AFA611-S8C-FamaFrench-LuckvSkill-JF10.pdf