- Place
- Central London, United Kingdom
- Years
- 2003–2026
- Policy
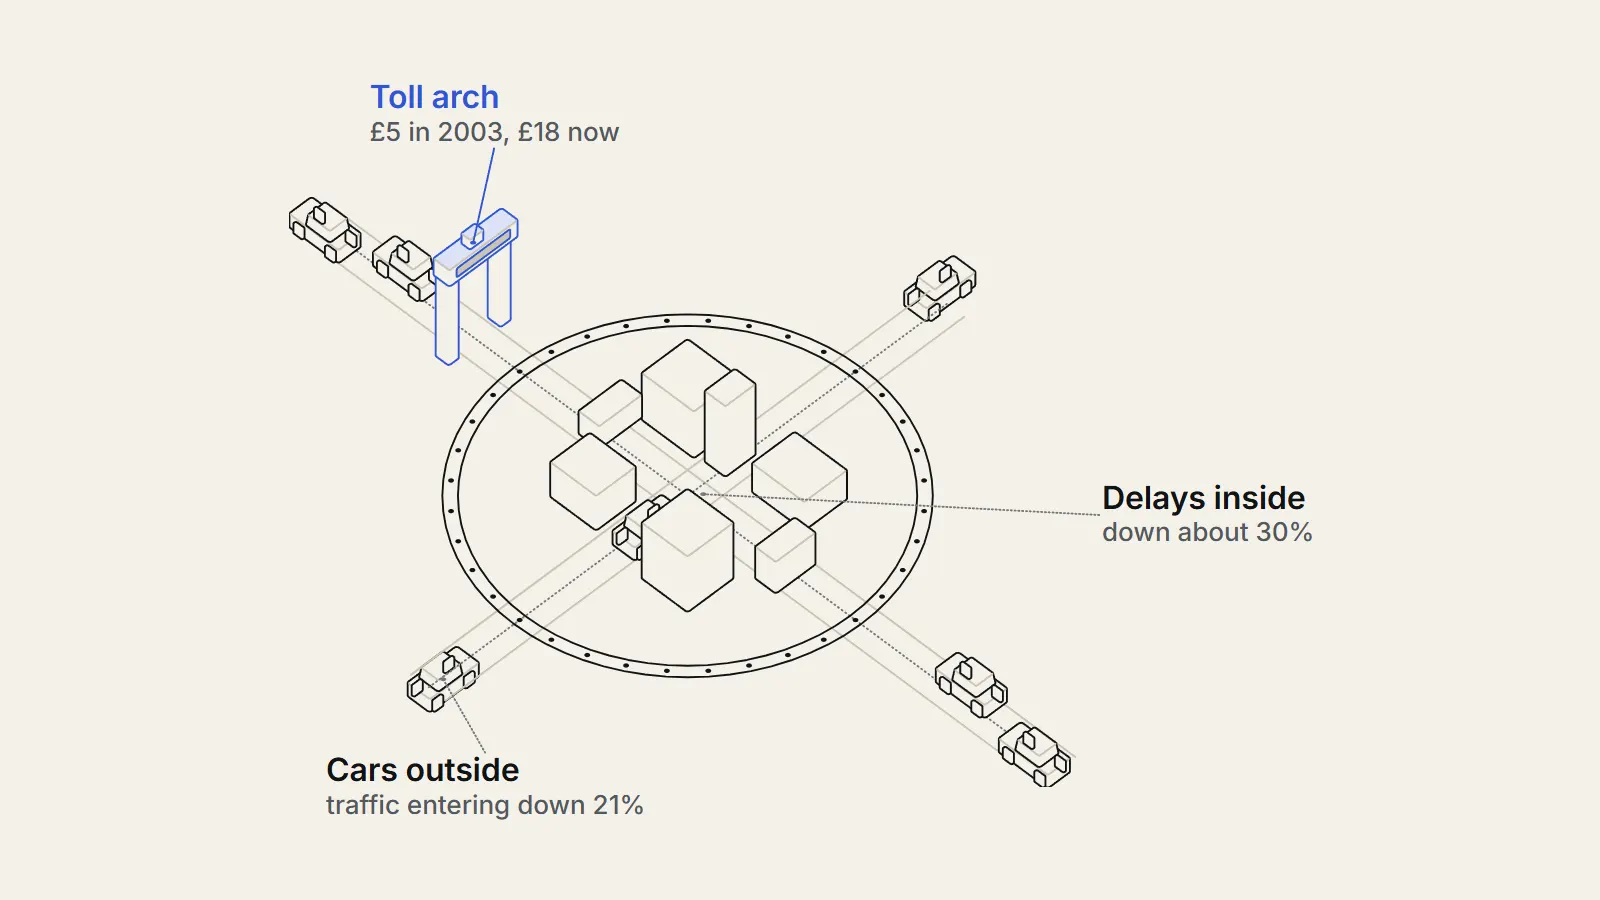
- London introduced a £5 daily charge to drive in a 22 square kilometre central zone on 17 February 2003, raised it to £8 in 2005 and to £18 in January 2026, with discounts and exemptions.
- Outcome
- Traffic entering the zone fell 21 percent by 2006 and delays fell 30 percent in year one, though the gain narrowed. TfL finds benefits above costs; critics argue running costs exceed the benefits.
The London congestion charge is a daily fee for driving in the centre of the city, started on 17 February 2003 at £52 and now £18.24 In its first years it cut traffic entering the zone by about a fifth2 and delays by about 30 percent.2 Whether it also paid for itself is argued among economists, and the evidence is clearer on traffic than on the net economic gain.
Before
This case study follows the London congestion charge from the economic case for it in the 1960s to the charge of 2026. We set out what Transport for London measured, what economists who doubted the scheme argued, and where the evidence is too thin to settle the matter.
Why central London needed congestion pricing
By the end of the twentieth century central London moved slowly. Traffic speeds in the zone had declined from around 18 kilometres an hour in the late 1970s to around 14 kilometres an hour between 2000 and 2002.5 The number of vehicles crossing the central London cordon had gone from about 1.6 million a day in the late 1970s to a peak of about 1.8 million in the late 1980s, then back to about 1.5 million by 2002.
The economics is the textbook case of a cost that drivers impose on each other. Before charging, TfL estimates that traffic moved at a typical network speed of about 14 kilometres an hour, a travel rate of around 4.2 minutes per kilometre, and somewhat more than half of that was caused by congestion, meaning the extra delay each vehicle suffers because others are present.2 The marginal vehicle added roughly five minutes per kilometre of delay to every other vehicle. At around 40 pence per minute and 5 to 10 kilometres travelled inside the zone, TfL puts the cost imposed by that extra vehicle at about £10 to £20.2
A driver deciding whether to enter the zone saw none of that cost. A price would make it visible. The idea was old: TfL traces the economic theory to the Smeed report of 1964, and the later critic Rémy Prud'homme notes that the notion was introduced in London in the 1960s and endorsed by most economists, yet few cities, with Singapore a notable exception, had put it into practice.26
Estimates of the size of the problem differ by method. A study quoted by the think tank Centre for Cities put the cost of congestion to central London at £1.2 billion a year in 2005.7 Prud'homme and Bocarejo, using their own demand and cost curves, estimated pre-charge congestion costs at only about 0.1 percent of the area's gross domestic product.6 That gap shapes the whole argument that follows.
The decision
The 2003 scheme: £5 a day to drive in 22 square kilometres
The route to the charge was political as much as economic. A 1998 referendum, in which 72 percent of participants voted yes, created a directly elected Mayor with powers to introduce road user charging and keep the revenue for transport in London.2 The first Mayor, Ken Livingstone, introduced the scheme, which was made through a Scheme Order in 2001 and confirmed in 2002.72
Congestion charging started on 17 February 2003. Until July 2005 it was a £5 daily charge for driving a vehicle on public roads within the zone between 07.00 and 18.30, Monday to Friday. The zone covers 22 square kilometres, including centres of government, law, business, finance and entertainment, and the Inner Ring Road that forms its boundary carries no charge.2
The scheme came with exemptions and discounts, listed below.2
- Wholly exempt: taxis, licensed private hire vehicles, motorcycles, pedal cycles and buses.
- Residents of the zone: a 90 percent discount, for a minimum weekly payment.
- Blue Badge holders and drivers of certain alternative-fuel vehicles: a 100 percent discount, so they pay nothing.
By law the net revenue must be spent on measures that further the Mayor's Transport Strategy.2
The scheme has changed several times since. The daily charge rose to £8 in July 2005 and a western extension opened on 19 February 2007.2 In February 2007 the charging day also ended earlier, at 18:00 in place of 18:30.5 The charge went from £10.00 to £11.50 in 2014 and to £15 in 2020, and it rose to £18 on 2 January 2026, the first increase since 2020. TfL says that is below inflation.3
The western extension was monitored from the start. In its first three months TfL reported traffic entering the extension down by 10 to 15 percent against 2006, and congestion there down 20 to 25 percent, from 1.5 to 1.2 minutes of excess delay per kilometre.2 The extension was the subject of a five-week consultation in autumn 2008, after a new Mayor, Boris Johnson, took office promising to re-focus the scheme.7
- 1964The Smeed report sets out the economic theory of road user chargingSource 2 (opens the source in a new tab)
- May 1998London votes by 72 percent in a referendum to create a directly elected Mayor with road charging powersSource 2 (opens the source in a new tab)
- February 17, 2003Congestion charging starts at £5 a daySource 2 (opens the source in a new tab)
- July 2005Daily charge rises to £8Source 2 (opens the source in a new tab)
- February 19, 2007Western extension opensSource 2 (opens the source in a new tab)
- 2014Charge rises from £10.00 to £11.50Source 3 (opens the source in a new tab)
- April 2019Cleaner Vehicle Discount introduced for electric vehiclesSource 3 (opens the source in a new tab)
- 2020Charge rises from £11.50 to £15Source 3 (opens the source in a new tab)
- October 27, 2025Mayor considers consultation responses on the next set of changesSource 8 (opens the source in a new tab)
- January 2, 2026Charge rises to £18 and a tiered electric-vehicle discount startsSource 3 (opens the source in a new tab)
The case against: a technical success, an economic failure?
A well-known academic challenge was the 2005 appraisal by Prud'homme and Bocarejo (https://www.piarc.org/ressources/documents/317,6.2-Prud-Homme-0405C11.pdf). They accepted that the charge worked as a traffic measure: vehicle-kilometres in the zone fell about 15 percent and speeds rose about 17 percent, and Londoners were largely satisfied.6 Their objection was to the arithmetic of benefits against costs.
They estimated congestion costs before the charge at €296,000 a day and after it at €24,000, so the charge removed about 90 percent. But running the system cost about €689,000 a day once capital and operating costs were counted, which was more than the €272,000 a day of congestion costs it removed, giving a daily net loss of €417,000 on their figures. Benefits for bus users, reliability and the environment were not included.6
a great technical and political success, seems to be an economic failure
— Rémy Prud'homme and Juan Pablo Bocarejo, 'The London congestion charge: a tentative economic appraisal', 2005
Prud'homme and Bocarejo also estimated the response of drivers to the price: a demand elasticity of about -0.83 for road use in the zone, meaning a 10 percent rise in the cost of a journey cut road use by roughly 8 percent.6
A second line of criticism concerned who paid. The Centre for Cities noted in 2008 that simple before-and-after comparisons are crude, and cited a GLA Economics study that found no significant effect on central London retail sales overall but a significant fall, put at 6.9 to 9.0 percent, in sales at the John Lewis store on Oxford Street.7 It said small and medium-sized businesses might be hit harder than large chains, which can pool deliveries.7
The same note reported that around three-quarters of key workers whose travel costs rose after the western extension found the extra cost difficult to meet.7 That is the fairness question in its simplest form: the charge works partly by making some journeys unaffordable.
What happened
What the data show: congestion pricing in London
The first-year traffic effect was large and has lasted. By 2006, according to the Fifth Annual Impacts Monitoring Report (https://content.tfl.gov.uk/fifth-annual-impacts-monitoring-report-2007-07-07.pdf), the number of vehicles with four or more wheels entering the zone during charging hours was 21 percent below 2002. The fall was steepest for the vehicles the charge targets: cars and minicabs entering the zone were down 36 percent, while buses and coaches were up 25 percent and pedal cycles up 49 percent.2
Delays fell too. TfL measured excess delay at 2.3 minutes per kilometre before charging and 1.6 minutes per kilometre in 2003, a reduction of 30 percent, with reductions of 26 percent in 2004 and 22 percent in 2005.2 Over the same years, TfL said, the charge had a broadly neutral effect on overall business performance in the zone.1
Road safety improved. Economists Colin Green, John Heywood and Maria Navarro compared accidents in the charged zone with control areas and found reductions of 38 to 40 percent in accidents, and estimated that the charge cut serious and fatal accidents in the zone by 46 a year9 and fatalities by 4.6 a year. They also found no evidence of long-term accident increases in adjacent areas, evening hours or uncharged vehicles.9
The charge also had effects beyond the road. TfL estimated reductions of 12 percent in emissions of nitrogen oxides and fine particles from road traffic inside the zone, and said the scheme saved between 40 and 70 accidents a year against the background trend.1 On buses, a campaign group count cited by the Centre for Cities found 29,000 additional passengers on 560 extra services in the morning peak in 2006 compared with 2002.7
Surveys of residents suggested the actual impact on individuals in 2003 was generally smaller than they had feared before charging started. Most respondents felt the charge was affordable, though more respondents inside the zone than in inner London said they found it difficult to pay, despite the 90 percent discount, probably because they paid more often.1
Revenue and cost
In the financial year 2006/07 the scheme took £213 million in revenue and cost £90 million to run2, leaving net revenue of £123 million. The standard £8 charge brought in £125 million, the £7 fleet charge £27 million, residents' payments £6 million and enforcement income £55 million.2 By law this money must be spent on transport.
TfL's own cost-benefit analysis reached a positive verdict. For the original scheme, TfL put the net benefits at around 1.5 times the operating costs plus other financial impacts such as lost tax revenue with a £5 charge, and 1.7 times with an £8 charge.2 The detailed ex post evaluation puts annual net benefits at £216 million for the £5 charge, against operating costs of £101 million and other financial impacts of £44 million, and £245 million for the £8 charge, against £99 million and £47 million. Against operating costs alone the ratios are 2.1 and 2.5.5
| Charge level | Annual net benefits | Operating costs plus other financial impacts | Overall surplus | Benefit-cost ratio |
|---|---|---|---|---|
| £5 | £216 million | £145 million | £71 million | About 1.5 |
| £8 | £245 million | £146 million | £99 million | Up to 1.7 |
ULEZ London charge: a second, separate scheme
The congestion charge is no longer the only road charge in London, and the official ULEZ page (https://tfl.gov.uk/modes/driving/ultra-low-emission-zone) sets out its rules. The Ultra Low Emission Zone targets pollution and not congestion. It operates 24 hours a day, every day except Christmas Day, across all London boroughs, and a vehicle that fails the emissions standard and is not exempt must pay £12.50 a day.10 A driver in the congestion zone with an older petrol or diesel vehicle can therefore face both charges.4
The two schemes interact. TfL said the Cleaner Vehicle Discount, introduced in 2019, gave electric vehicles a discount on the congestion charge (it ended on 25 December 2025 and was replaced by a tiered one), and the number of registered electric vehicles rose almost sixfold, from around 20,000 to more than 116,000.3 Electric vehicles were expected to make up close to 20 percent of vehicles in the zone by the end of 2025. Without changes, TfL estimated more than 2,000 additional vehicles in the zone on an average weekday.
The consultation on the new arrangements drew 4,561 responses8, including 99 from stakeholders, and the Mayor considered them on 27 October 2025.8 The result was the £18 charge and a tiered discount: 50 percent for electric vans, heavy goods vehicles and quadricycles and 25 percent for electric cars, falling to 25 and 12.5 percent from March 2030.3
What economists still disagree on
Where economists and TfL disagree about the London congestion charge
The first dispute is whether congestion has come back. TfL reported that in 2006 congestion inside the zone was 8 percent lower than in 2002, down from the 30 percent seen after the charge began.2 The Centre for Cities went further, writing that congestion in central London had by 2007 reached pre-charging levels, though it added that without charging it would be higher still.7
TfL says that comparison is misleading. It points to a sharp rise in roadworks, notably by utilities, in the second half of 2006, and to a longer-term trend in which traffic management, bus priority and better conditions for pedestrians and cyclists reduced the road space available to general traffic.2 On that account, the charge is still delivering congestion relief in line with the 30 percent seen in the first year, when compared with conditions without the scheme.
The Centre for Cities offers another candidate cause. It points to growth in the population of the central boroughs, which is relevant because zone residents can claim a 90 percent discount.7 The two explanations are not exclusive, and the data cannot cleanly separate them.
The second dispute is how to value the benefits. TfL's own ex post evaluation lists the value placed on time savings and the effect outside the charged area among the contested issues raised by outside evaluators.5 The other difference is how much of the cost of running the system to set against the benefits, which is the core of the Prud'homme and Bocarejo calculation.6 Both accept the traffic reductions.
The third is who gains. TfL's own ex post evaluation of the £5 charge found that business users had a net benefit of around £14 million, individuals a net disbenefit of £22 million and bus passengers a benefit of about £40 million, for an overall net benefit to transport users of £36 million. It also estimated that about 25 percent of road user benefits went to those who paid the charge and 75 percent to those who did not.5
Economists were generally warm about the idea. Jonathan Leape's 2006 article in the Journal of Economic Perspectives treats the charge as an example of economic reasoning applied to policy, and reports that congestion had fallen substantially and that the scheme was largely popular.11 The question this case study keeps returning to is whether warm reviews of the principle translate into a net gain once running costs are counted.
a triumph of economics
— Jonathan Leape, 'The London Congestion Charge', Journal of Economic Perspectives, 2006, as described in the journal abstract
Political acceptability is a further question that the data cannot resolve. In early 2007 an electronic petition against national road pricing gathered nearly two million signatures, and ministers then backed away from a UK-wide scheme and turned to local ones.7 In London the charge became a key battleground in the May 2008 mayoral election.7 The charge survived, but its support was never guaranteed.
How much of the later loss of road space to buses, cycling and streetworks should count as a cost of the charge, a use of the space it freed, or an unrelated policy?
Limits of the evidence are real. Most evaluations compare conditions before and after 2003, with no randomised comparison, and traffic in central London was already trending down before charging, which TfL attributes largely to parking policy.5 The charge's effects on air quality and accidents are easier to see than its effect on the wider economy, and the original monitoring ran on a limited set of surveys.
Lessons
Key takeaways
- A price on road space cut traffic quickly and lastingly: vehicles with four or more wheels entering the zone were 21 percent below 2002 levels four years on.
- The congestion benefit shrank over time as road space was reallocated and roadworks increased. The charge works against a moving background.
- Whether the scheme pays for itself depends on the value of time and on how the system's costs are counted, which is why TfL and its critics reach opposite conclusions.
- Revenue made the scheme politically and practically useful: £123 million net in 2006/07, spent on transport.
- Charges have to keep up with their goals. Rising EV numbers led TfL to replace the discount to avoid around 2,000 more vehicles a day.
What carries over is the mechanism: a price on road space reduces traffic where there are public transport alternatives and where the charge is large relative to the cost of switching. What does not carry over automatically is the size. Central London has one of the densest public transport networks in the world, and the 1998 vote, the revenue lock and the exemptions all shaped how the scheme was received.
Our own caution is that the strongest evidence is from the first years. We have less rigorous evidence on the later charge levels, and our sources for ULEZ describe its rules and not its measured effects.
Sources
- 1Congestion Charging: Third Annual Monitoring Report (opens the source in a new tab) · Transport for London, 2005 · Primary source · https://content.tfl.gov.uk/central-london-congestion-charging-impacts-monitoring-third-annual-report.pdf
- 2Central London Congestion Charging: Impacts Monitoring, Fifth Annual Report (opens the source in a new tab) · Transport for London, 2007 · Primary source · https://content.tfl.gov.uk/fifth-annual-impacts-monitoring-report-2007-07-07.pdf
- 3Changes confirmed to the Congestion Charge to keep London moving sustainably (TfL press release, as published by WiredGov) (opens the source in a new tab) · Transport for London, 2025 · Primary source · https://www.wired-gov.net/wg/news.nsf/articles/Changes+confirmed+to+the+Congestion+Charge+to+keep+London+moving+sustainably+14112025102000
- 4Congestion Charge (official page) (opens the source in a new tab) · Transport for London, 2026 · Primary source · https://tfl.gov.uk/modes/driving/congestion-charge
- 5Central London Congestion Charging Scheme: ex-post evaluation of the quantified impacts of the original scheme (opens the source in a new tab) · Transport for London, 2007 · Primary source · https://content.tfl.gov.uk/ex-post-evaluation-of-quantified-impacts-of-original-scheme.pdf
- 6The London congestion charge: a tentative economic appraisal (opens the source in a new tab) · PIARC Seminar on Road Pricing (conference paper; also Transport Policy 12, 2005), 2005 · Paper · https://www.piarc.org/ressources/documents/317,6.2-Prud-Homme-0405C11.pdf
- 7Congestion Charging: A tool to tackle congestion in UK cities? (opens the source in a new tab) · Centre for Cities, 2008 · Report · https://www.centreforcities.org/wp-content/uploads/2014/09/08-10-02-Congestion-Charging.pdf
- 8Congestion Charge proposals (consultation page) (opens the source in a new tab) · Transport for London, 2025 · Primary source · https://haveyoursay.tfl.gov.uk/congestion-charge-proposals
- 9Traffic Accidents and the London Congestion Charge (opens the source in a new tab) · Lancaster University Management School Working Paper 2014/015, 2014 · Paper · https://www.lancaster.ac.uk/media/lancaster-university/content-assets/documents/lums/economics/working-papers/LondonCongestionCharge.pdf
- 10Ultra Low Emission Zone (official page) (opens the source in a new tab) · Transport for London, 2026 · Primary source · https://tfl.gov.uk/modes/driving/ultra-low-emission-zone
- 11The London Congestion Charge (opens the source in a new tab) · Journal of Economic Perspectives 20(4), 2006 · Study · https://ideas.repec.org/a/aea/jecper/v20y2006i4p157-176.html