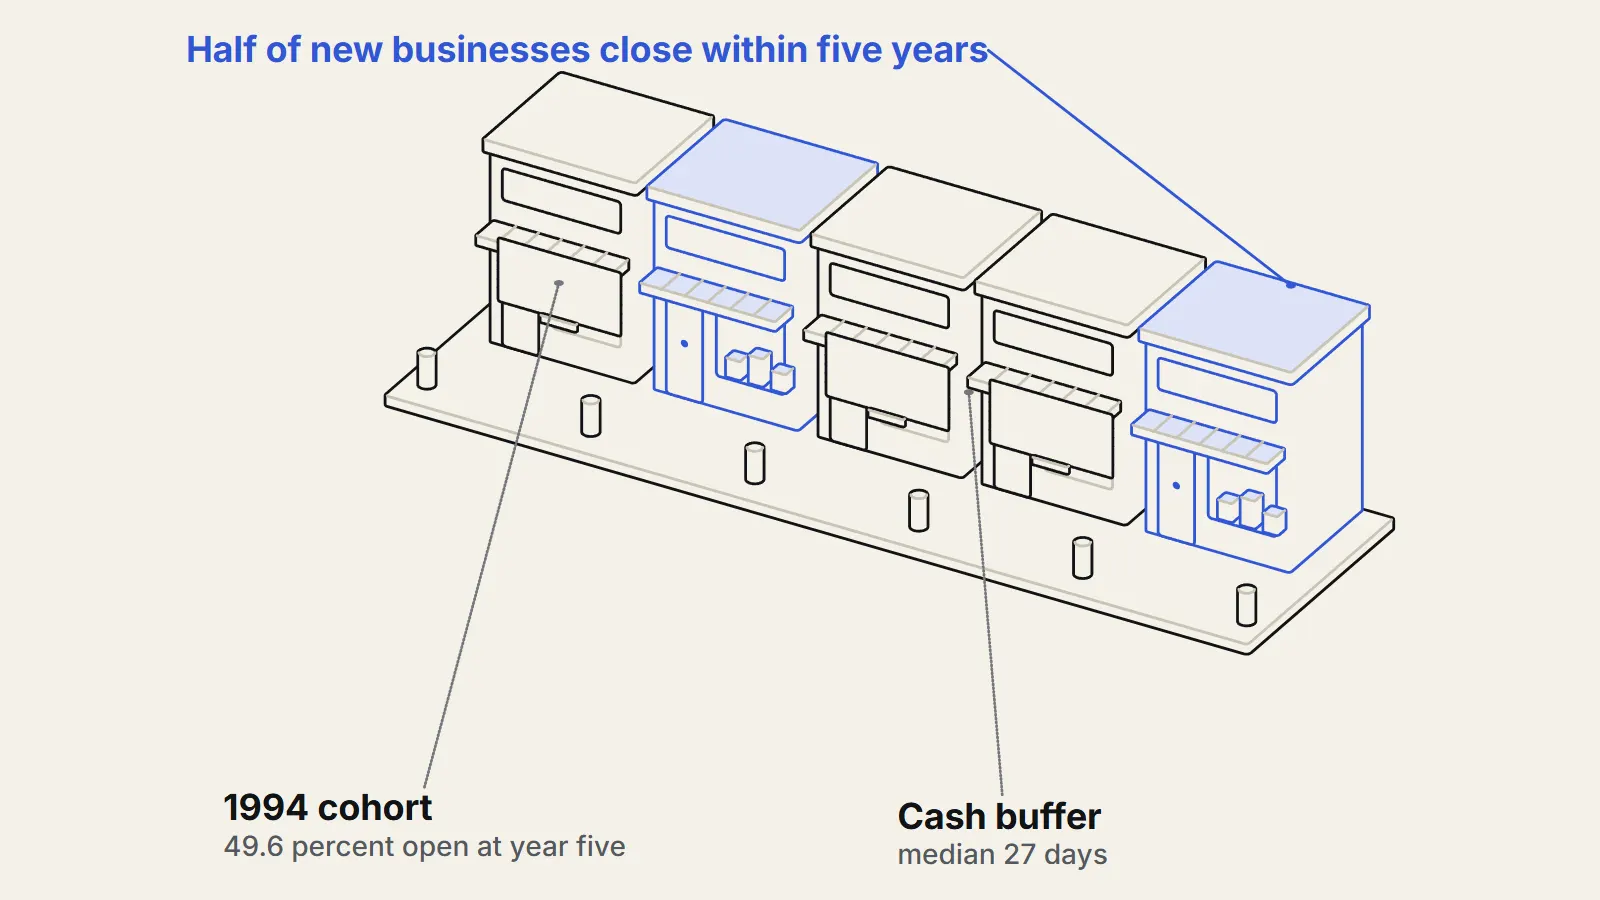
About half of new US business establishments are still open five years after they start, and about a third are open after ten. That is the figure that official US data on business survival show, and it has been remarkably steady across cohorts for three decades. The data record whether a business stays open, not why it closes, so the reasons have to come from surveys and cash-flow studies. These point to money running short at the wrong moment, often before a business has built a cushion. This piece explains what the survival numbers measure, what they show, and what is and is not known about why businesses fail.
What does official data say about business survival?
The main source is the Business Employment Dynamics (BED) program of the US Bureau of Labor Statistics. Its entrepreneurship page (https://www.bls.gov/bdm/entrepreneurship/entrepreneurship.htm) explains that BED groups new business establishments by birth year into cohorts, then tracks how many survive from one year to the next. An establishment is a single physical location, such as one shop or one office, which is not always the same as a whole company.1
The BLS survival table (https://www.bls.gov/bdm/us_age_naics_00_table7.txt) covers private-sector cohorts from 1994 onward and runs through March 2025. For the cohort that opened in the year ended March 1994, 49.6 percent of establishments were still open after five years and 33.6 percent after ten2. Later cohorts look similar: 51.5 percent of the 2019 cohort survived to five years, and 34.7 percent of the 2015 cohort were open at year ten.2 Most closures come early. Across the cohorts shown, roughly 78 to 80 percent are open after one year and about two thirds to 70 percent after two.2
Is the early danger as steep as people say?
Yes in the sense that the first few years carry the highest risk, but the data also show the risk falls with age. In a 2007 BLS study (https://www.bls.gov/opub/mlr/2007/09/art1full.pdf) of 212,182 establishments that opened in the second quarter of 1998, 44 percent survived to the fourth year and 31 percent to the seventh. The authors found the largest exits in the first and second years, and described survival as decreasing at a decreasing rate.3 In plain terms, each extra year survived makes the next year safer.
Industry matters too. The BLS entrepreneurship page says health care and social assistance consistently rank among the industries with the highest survival, while construction ranks among the lowest.1 The 2007 study found the information sector had the lowest survival at 24 percent by year seven, with education and health services the highest at 44 percent.3
Why do businesses fail? What the cash-flow evidence says
The BED tables count survival. They do not record why an establishment closed, and a closure is not always a failure: an owner may retire, relocate, or choose to stop. To understand causes, researchers use other data, and one consistent theme is thin cash reserves.
The JPMorganChase Institute studied anonymised bank transactions from about 597,000 small businesses between February and October 2015. Its "Cash is King" report (https://www.jpmorganchase.com/institute/all-topics/business-growth-and-entrepreneurship/insight-cash-is-king) found that the median small business held 27 cash buffer days4, meaning it could cover 27 days of spending if no money came in.4 The report adds that labour-intensive and low-wage industries hold fewer buffer days than capital-intensive ones. A month of cash is a thin cushion for a business with rent, wages and suppliers to pay.
Survey evidence points the same way. The Federal Reserve's Small Business Credit Survey report on employer firms (https://www.fedsmallbusiness.org/reports/survey/2025/2025-report-on-employer-firms) (7,653 respondents, published in March 2025) found that 56 percent of firms cited paying operating expenses and 51 percent cited uneven cash flows5 as financial challenges.5 Because it surveys firms that are operating or temporarily closed, it measures stress, not failure itself.
Is cash flow the whole story?
No. Cash trouble is often the last step in a longer chain: weak demand, rising costs, a lost customer or a bad location can drain cash. The same Federal Reserve report notes that firms were more likely to report falling revenue than rising revenue in the prior 12 months, which is the kind of change that turns a thin buffer into a crisis.5 The data do not separate these causes cleanly.
What is disputed or hard to interpret?
The strongest counterargument is that "failure" is a loose word. BED tracks establishments, and the 2007 study tracked them by identifier even when ownership changed, so a business that is sold and keeps trading is not counted as a closure.3 Equally, an owner who closes one shop to open a better one adds to the closure count without being a failure in the usual sense. This means survival rates are a guide to turnover, not an exact measure of owners losing money.
A second caution is that the Federal Reserve survey is a convenience sample, which the report itself says may carry biases, so its percentages describe the firms that answered rather than all firms.5 The JPMorganChase data cover customers of one bank and are from 2015, so they may not describe today's cash positions.
What is not known?
Public data do not tell us what share of closures are involuntary, how many owners closed at a profit, or how much each cause contributes. Nor do they show whether better cash management would have saved a given business. The published tables cover private-sector establishments, and the specific percentages above will shift as new cohorts mature. The table begins with the cohort that opened in the year ended March 1994, so it says nothing about earlier decades, and recent cohorts cannot yet be compared with older ones at five or ten years of age. Larger, more detailed breakdowns by industry, state or business size exist in the BLS tables, but this piece does not use them, so it should not be read as a forecast for any one kind of business or any one owner.
Key takeaways
- About half of new US establishments are open after five years and about a third after ten, a pattern that has held across cohorts since 1994.
- The risk is highest in the first two years and falls with each year survived.
- Survival data count closures but not the reasons, and a closure is not always a failure.
- Cash is thin for many small firms: the median had 27 days of cash buffer in a 2015 JPMorganChase Institute study, and 51 percent of firms in a 2025 Federal Reserve survey reported uneven cash flows.
Sources
- 1Entrepreneurship and the U.S. Economy (BED survival data) (opens the source in a new tab) · U.S. Bureau of Labor Statistics, 2016 · Primary source · https://www.bls.gov/bdm/entrepreneurship/entrepreneurship.htm
- 2Table 7. Survival of private sector establishments by opening year (opens the source in a new tab) · BLS Business Employment Dynamics, 2025 · Dataset · https://www.bls.gov/bdm/us_age_naics_00_table7.txt
- 3Business Employment Dynamics data: survival and longevity, II (opens the source in a new tab) · Monthly Labor Review, U.S. Bureau of Labor Statistics, 2007 · Paper · https://www.bls.gov/opub/mlr/2007/09/art1full.pdf
- 4For Small Businesses: Cash is King (opens the source in a new tab) · JPMorganChase Institute, 2016 · Study · https://www.jpmorganchase.com/institute/all-topics/business-growth-and-entrepreneurship/insight-cash-is-king
- 52025 Report on Employer Firms: Findings from the 2024 Small Business Credit Survey (opens the source in a new tab) · Federal Reserve Banks (Small Business Credit Survey), 2025 · Survey · https://www.fedsmallbusiness.org/reports/survey/2025/2025-report-on-employer-firms