Unit economics is the profit and loss of one customer. It asks how much money a single customer brings in, what it costs to win and serve that customer, and how long it takes to earn back the cost of winning them. If one customer earns more than they cost, growth can create a profitable business. If not, every new customer deepens the loss. This piece defines the main terms, walks through a worked example using real figures from a public company, and covers where the method breaks down.
What are the building blocks of unit economics?
Four numbers do most of the work. Revenue per customer is what a customer pays, per order or per year. Gross margin is the share of revenue left after the direct costs of delivering the product, such as shipping or hosting. Customer acquisition cost, or CAC, is what a company spends on sales and marketing to gain one new customer. Lifetime value, or LTV, is the total gross profit a customer is expected to produce before leaving.
Public filings show how companies define these terms, and the definitions differ in small ways. In its annual report, the software company HubSpot calculates CAC (https://www.sec.gov/Archives/edgar/data/0001404655/000119312515079000/d849700d10k.htm) by dividing its total sales and marketing expenses, excluding stock-based compensation, by the number of new customers added in the same period.1 The pet products company Bark defines CAC as media spend in its direct-to-consumer business divided by new subscriptions. It defines LTV as the cumulative gross profit from a subscription over its average life.2 The lesson is to check the definition before comparing two companies' numbers.
How do you calculate payback time?
Payback time is how long it takes a customer's gross profit to cover what it cost to acquire them. The simple formula is CAC divided by gross profit per period. A short payback is valuable because the company gets its cash back quickly and can spend it again. A long one means money is tied up in customers who may leave before they repay it.
Companies measure this in different ways. Bill.com, a business payments company, defines payback period (https://www.sec.gov/Archives/edgar/data/1786352/000178635224000035/bill-20240630.htm) as the number of quarters it takes for the cumulative non-GAAP gross profit from customers acquired in a quarter to exceed that quarter's total sales and marketing spend. For its standalone customers acquired in fiscal 2023, it reported an average payback of approximately six quarters3, or about a year and a half.3
A worked example with real numbers
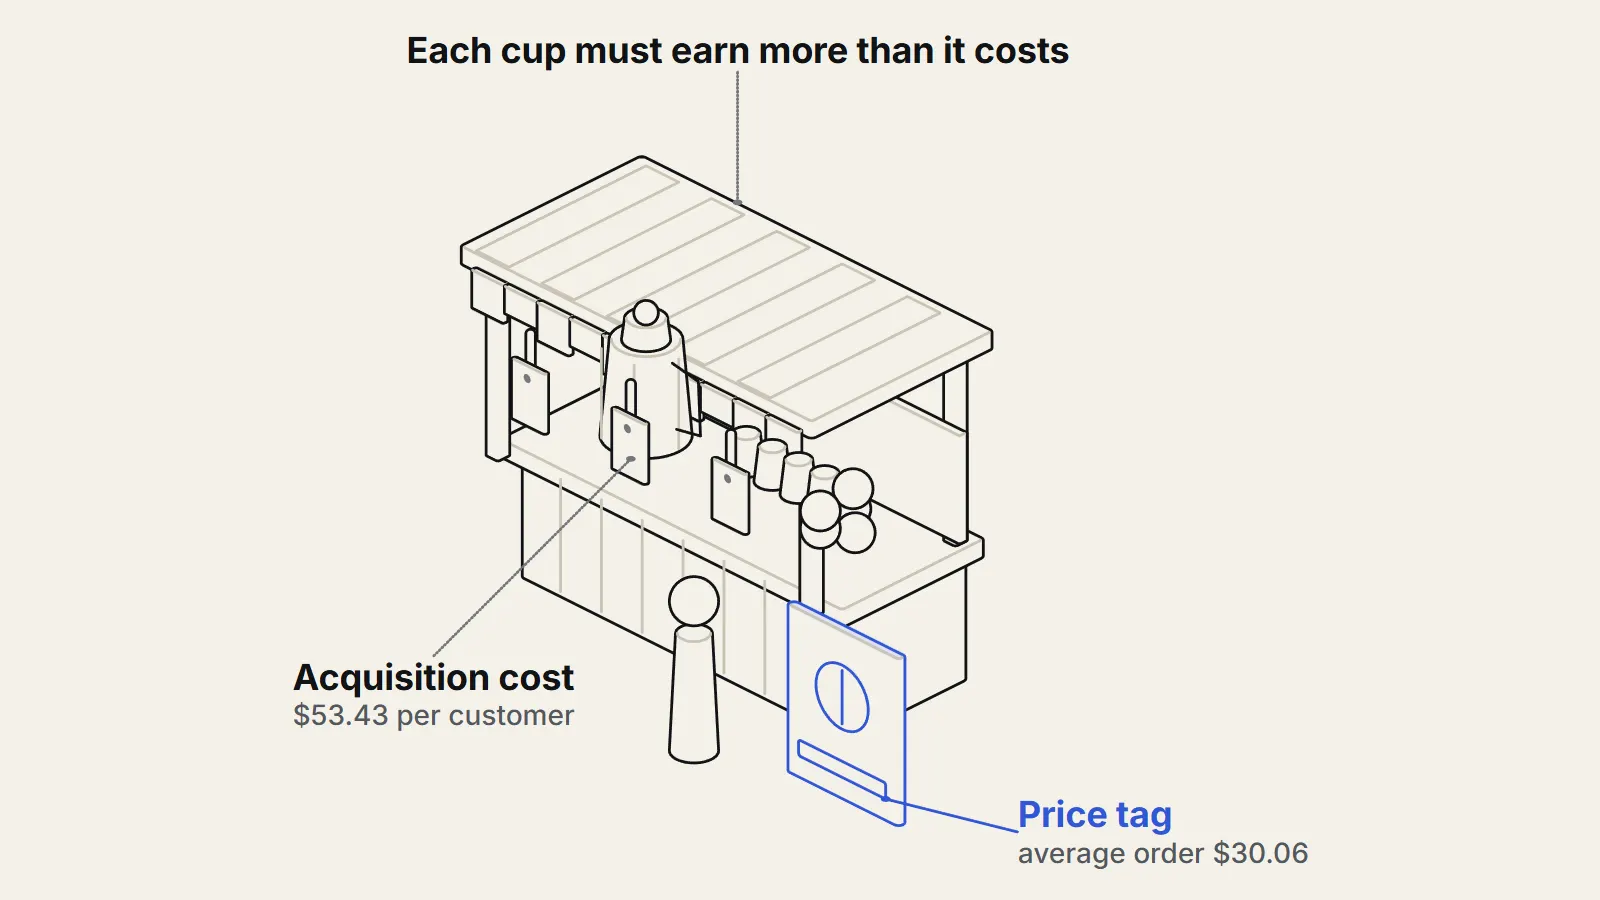
Bark sells monthly subscription boxes of dog toys and treats. Its annual report for the year ended March 31, 2022 (https://www.sec.gov/Archives/edgar/data/1819574/000181957422000049/bark-20220331.htm) reports an average order value of $30.062 per shipment, a customer acquisition cost of $53.43, and average monthly churn (the share of subscription shipments cancelled each month) of 7.0 percent. Its total gross profit was 55.6 percent of revenue.2 The company also reports a ratio of LTV to CAC of 4.7, meaning that each subscription is expected to earn 4.7 times its acquisition cost in gross profit.2
Here is a simple version of the same calculation, using only those published figures. This is an illustration built from them, not Bark's method. At 7.0 percent monthly churn, a subscription lasts about 14 months on average (one divided by 0.07). About 14.3 shipments at $30.06 bring in roughly $430 of revenue. At a 55.6 percent gross margin, that is about $239 of gross profit, which is LTV. Divide by the $53.43 CAC and the ratio is about 4.5, close to the 4.7 Bark reports. The gap is plausible, since Bark measures LTV on direct-to-consumer gross profit and the illustration uses the company-wide margin.
Payback follows from the same inputs. Each $30.06 order earns about $16.71 in gross profit at a 55.6 percent margin, so recovering $53.43 takes a little over three monthly shipments. After that, each shipment adds profit. That is a healthy shape, but only if customers stay for at least that long, which is why churn matters as much as price.
How does a business-to-business company compare?
Selling to businesses usually means a higher price per customer and a higher cost to win one. HubSpot's 2014 annual report shows average subscription revenue per customer of $8,926 and CAC of $11,9771 for the year.1 That means the cost of winning a customer was about 1.3 times the first year of subscription revenue, before any cost of serving them. The company reported a subscription dollar retention rate of 92.7 percent, which signals that most subscription revenue from existing customers was retained, so the investment could still pay off over several years.1
Software has an advantage on gross margin. Dropbox reported a gross margin of 83 percent for 2024, which means most of each extra dollar of revenue is gross profit.4 A business with a lower margin, like Bark's at 55.6 percent, needs more customers or more time to earn back the same CAC.
What is the strongest case against relying on these ratios?
Three points. First, the ratios depend on assumptions about the future. LTV uses an average customer life, but churn can change, and Bark's own churn moved from 7.5 percent in fiscal 2020 to 5.9 percent in 2021 and 7.0 percent in 2022.2 Its LTV to CAC ratio moved from 3.9 to 6.3 to 4.7 over the same years.2 A small change in churn can swing LTV a long way.
Second, CAC averages hide the marginal cost. The first customers are often cheap, from friends and word of mouth, and later customers cost more as a company runs out of easy audiences. Third, definitions can flatter. Excluding stock-based compensation from CAC, as HubSpot does, or measuring only media spend, as Bark does, leaves out real costs that other companies might include.1
What is not known?
These ratios describe averages for a whole group of customers, so they cannot tell you which individual customers will be profitable. They also cannot capture factors like customer support costs, discounts, or returns unless a company includes them. Rules of thumb such as a 3 to 1 ratio of LTV to CAC are common in the industry, but they are conventions, not laws, and vary by business type.
Key takeaways
- Unit economics asks whether one customer earns more gross profit than they cost to acquire and serve.
- Payback time is CAC divided by gross profit per period; Bill.com reported about six quarters for its fiscal 2023 standalone customers.
- Bark's 2022 figures show how the pieces fit: $30.06 per order, $53.43 CAC, 7.0 percent monthly churn and an LTV to CAC ratio of 4.7.
- Ratios depend on churn and on how each company defines CAC, so check definitions before comparing firms.
Sources
- 1HubSpot, Inc. Form 10-K for fiscal year ended December 31, 2014 (opens the source in a new tab) · U.S. Securities and Exchange Commission (HubSpot, Inc.), 2015 · Primary source · https://www.sec.gov/Archives/edgar/data/0001404655/000119312515079000/d849700d10k.htm
- 2BARK, Inc. Form 10-K for fiscal year ended March 31, 2022 (opens the source in a new tab) · U.S. Securities and Exchange Commission (BARK, Inc.), 2022 · Primary source · https://www.sec.gov/Archives/edgar/data/1819574/000181957422000049/bark-20220331.htm
- 3BILL Holdings, Inc. Form 10-K for fiscal year ended June 30, 2024 (opens the source in a new tab) · U.S. Securities and Exchange Commission (BILL Holdings, Inc.), 2024 · Primary source · https://www.sec.gov/Archives/edgar/data/1786352/000178635224000035/bill-20240630.htm
- 4Dropbox, Inc. Form 10-K for fiscal year 2024 (opens the source in a new tab) · U.S. Securities and Exchange Commission (Dropbox, Inc.), 2025 · Primary source · https://www.sec.gov/Archives/edgar/data/1467623/000146762325000011/dbx-20241231.htm