Summary
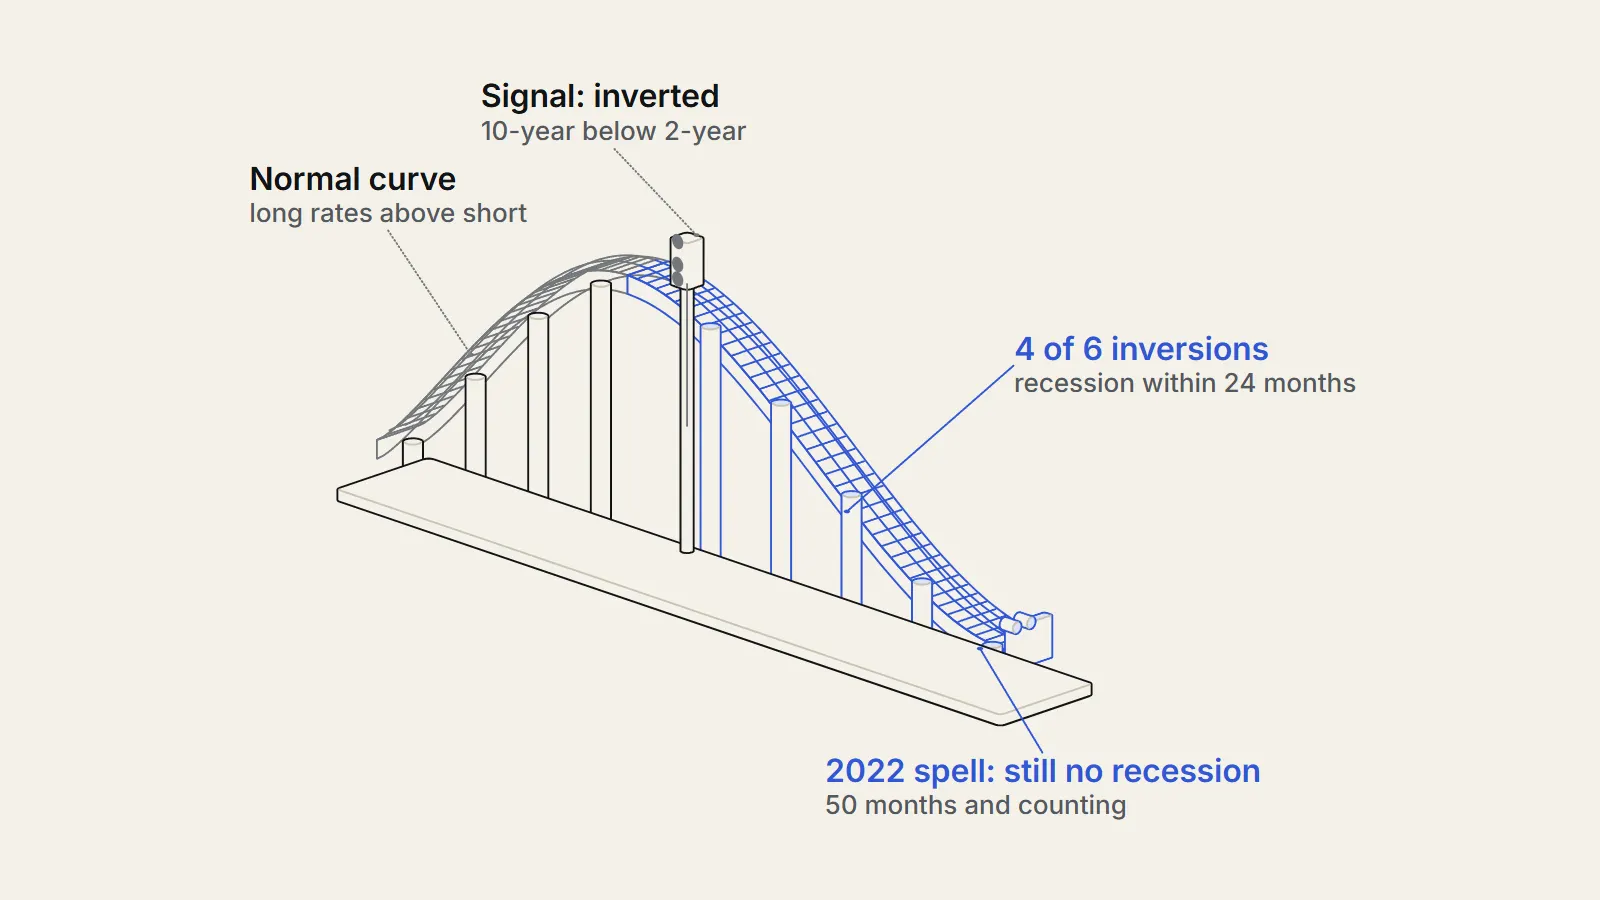
Does an inverted yield curve predict recessions? We tested it on US Treasury yields against official recession dates, using daily data back to 1976 and monthly measures of accuracy. All four recessions since 1990 followed an inversion of the 10-year minus 3-month spread, and a 12-month-ahead rank score reached 0.87 before 20201, in line with published work. But only four of six spells of the 10-year minus 2-year spread were followed by a recession within 24 months, and the spell that began in 2022 has not been.
The question
What is an inverted yield curve and why does it matter?
A yield curve plots the interest rate that the US government pays to borrow for different lengths of time. Usually lending for ten years pays more than lending for three months, because the lender gives up access to the money for longer. An inverted yield curve is the opposite case: short-term rates are higher than long-term rates.
The signal matters because it is cheap, public and daily. Investors, journalists and central bankers watch it, and a move below zero often leads to headlines about a coming recession. If the signal is as good as its reputation, it deserves attention. If it is weaker than its reputation, those headlines mislead. We wanted to check on the numbers rather than on memory.
What does an inverted yield curve mean for the economy?
An inverted yield curve means short-term rates are higher than long-term rates, so the spread falls below zero. In our data it has been a warning, not a certainty. After an inverted month, the share followed by a recession start within 24 months was 65 percent for the 10-year minus 2-year spread, against 15 percent after a non-inverted month.
What would count as a yes?
Our question: when the yield curve inverts, does a US recession begin within 24 months? We set two tests before looking. Test one is a hit rate for spells: the share of inversion spells that are followed by a recession start within 24 months. Test two is coverage: the share of recessions that had an inversion in the prior 24 months. We would call the claim supported if both shares were above about three quarters, and unsupported if either was below one half.
Our hypothesis, written before we opened the data, was that the signal is useful but far from perfect, and that the 10-year minus 3-month version works better than the 10-year minus 2-year version.
What have other studies found?
The idea has a long record in the research literature. In 1996 two economists at the Federal Reserve Bank of New York reported on the 10-year minus 3-month spread. Their abstract is short and strong.2
It is simple to use and significantly outperforms other financial and macroeconomic indicators in predicting recessions two to six quarters ahead.
— Arturo Estrella and Frederic S. Mishkin, Federal Reserve Bank of New York, 1996, abstract
Two decades on, Michael Bauer and Thomas Mertens of the San Francisco Fed compared several spreads using monthly data from January 1972 to July 2018. Predicting whether the economy is in recession 12 months ahead, four spreads had an area under the curve, a score where 0.5 is a coin toss and 1.0 is perfect, between 0.85 and 0.89, with the 10-year minus 3-month version slightly best.3 We reproduce this score on our data below.
Not every study agrees on which spread is best. Eric Engstrom and Steven Sharpe of the Federal Reserve Board argue that a near-term forward spread, which reads the market expectation of policy easing over the next 12 to 18 months, beats long-term spreads such as the 10-year minus 2-year, and that yields beyond 18 months add nothing.4 Jonathan Wright, also at the Board, found that adding the level of the federal funds rate (https://therealigned.com/story/how-the-fed-sets-interest-rates) to the term spread improves the forecast of recessions both in sample and out of sample.5 Wright adds that growth, recessions and interest rates are all endogenous, so any association among them is a reduced-form correlation. Bauer and Mertens end on a similar note:
Great caution is therefore warranted in interpreting the predictive evidence.
— Michael Bauer and Thomas Mertens, Federal Reserve Bank of San Francisco, 2018
Our contribution is small. We rebuild the tests from raw public data, add the years since 2018, and look hard at the 2022 episode that the older papers could not see.
Data
Which yield spreads and recession dates did we use?
We downloaded three core series as CSV files from FRED (https://fred.stlouisfed.org/series/T10Y3M). The first two are daily spreads in percentage points: the 10-year Treasury yield minus the 2-year yield, starting in June 1976, and minus the 3-month yield, starting in January 1982. Both end on 15 October 2026. The third is the monthly recession indicator that follows the dates of the National Bureau of Economic Research (https://www.nber.org/research/data/us-business-cycle-expansions-and-contractions); its last observation is September 2026.
The yields themselves are published by the Federal Reserve in the H.15 release (https://www.federalreserve.gov/releases/h15/). They are not prices of one particular bond. The Treasury builds a curve from closing bid yields on actively traded securities and reads off fixed maturities, so a 10-year yield exists every day even when no bond has exactly ten years left.9
Which extra series gave context?
To see what surrounded each inversion we added three monthly or quarterly series from FRED: the effective federal funds rate, real gross domestic product, and the unemployment rate. They let us ask whether inversions followed rate rises and whether growth and unemployment behaved differently afterwards.81011
How are recessions dated, and why does it matter?
The recession dates are not ours. The NBER Business Cycle Dating Committee describes a recession as a significant decline in economic activity, spread across the economy, that lasts more than a few months.12 It dates turning points after the fact, typically months after a peak. Two things follow. A very recent turning point cannot yet be in the data, and the dates could in principle be revised. We treat the dates as the best available record, and we say where this matters.
A note on timing. The NBER says a recession starts in the month after a peak, which is how the FRED indicator is built, so our recession start months are one month later than the peak months.13 For example, the peak of January 1980 gives a start in February 1980.
Method
How did we define an inversion spell and a hit?
Step one: we averaged each daily spread by calendar month. Step two: a month counted as inverted if the average was below zero. Step three: a new spell began at an inverted month with no inverted month in the previous 12. Step four: for each spell we found the first recession start month after it, using months where the indicator turned from 0 to 1, and counted the lag in months. A spell was a hit if the lag was 24 months or less.
Step five covers the other direction. For each recession since the first month of the series plus 24 months, we asked whether any inverted month fell in the 24 months before it. This is the coverage test.
How did we measure accuracy beyond hits?
Counting spells gives very small numbers, so we added a score that uses every month. For each month, we took the spread, multiplied it by minus one so that deeper inversion means higher risk, and asked how well that ranking separates the months that were in recession 6, 12 or 18 months later from the months that were not. The score is the area under the curve, AUC. It equals the probability that a randomly chosen future recession month had a lower spread than a randomly chosen non-recession month. A value of 0.5 is a coin toss.
We computed it on the full sample, up to December 2019, from January 1990, and without the 2020 recession months. We did not fit a statistical model, so there is nothing to overfit.
How did we test sensitivity to our own choices?
Our definitions are choices. So we repeated the spell count with three thresholds (0, minus 0.25 and minus 0.5 points), with and without a requirement of three inverted months in a row, and with 12, 24 and 36 month windows. We also redid the timing from raw daily readings. Finally, we compared growth and unemployment after months with an inverted, flat and normal curve, where flat means a spread between 0 and 1 point.
We ran everything in one node script and recomputed the timing in a second script from raw daily readings. The two agree on which recessions had a prior inversion, with one difference: for the 10-year minus 2-year spread, a single-day rule counts the three negative days of August 2019 as a warning before March 2020, while the monthly average rule does not.
Findings
How often did an inverted yield curve lead to recession?
For the 10-year minus 2-year spread there were six spells and four were followed by a recession start within 24 months6. The lags were 17, 19, 14 and 23 months. One brief spell in June 1998 was followed by a recession only after 34 months, and the spell that began in July 2022 has not been followed by one in 50 months of recession data.67
The 10-year minus 3-month spread had five spells and four were followed by a recession within 24 months1, at lags of 14, 9, 17 and 10 months, a mean of 12.5. The exception is the spell from November 2022 to August 2025, which is 46 months old at the end of the recession data.1
| Spread | Spell (monthly mean below 0) | Next recession start | Lag (months) | Within 24 months |
|---|---|---|---|---|
| 10Y-2Y | 1978-09 to 1982-06 | 1980-02 | 17 | yes |
| 10Y-2Y | 1989-01 to 1990-03 | 1990-08 | 19 | yes |
| 10Y-2Y | 1998-06 | 2001-04 | 34 | no |
| 10Y-2Y | 2000-02 to 2000-12 | 2001-04 | 14 | yes |
| 10Y-2Y | 2006-02 to 2007-05 | 2008-01 | 23 | yes |
| 10Y-2Y | 2022-07 to 2024-08 | none by 2026-09 | none | no |
| 10Y-3M | 1989-06 to 1989-12 | 1990-08 | 14 | yes |
| 10Y-3M | 2000-07 to 2001-01 | 2001-04 | 9 | yes |
| 10Y-3M | 2006-08 to 2007-05 | 2008-01 | 17 | yes |
| 10Y-3M | 2019-05 to 2020-02 | 2020-03 | 10 | yes |
| 10Y-3M | 2022-11 to 2025-08 | none by 2026-09 | none | no |
Did every recession follow an inverted yield curve?
Nearly. Five of the six recessions since 1976 had an inverted 10-year minus 2-year month in the prior 24 months. The exception was March 2020, where the spread went below zero on just 3 daily readings in August 2019. The 10-year minus 3-month spread did better on that recession: its daily readings first went negative on 22 March 2019, with 116 negative daily readings from January 2019 to February 2020 (the monthly mean first fell below zero in May 2019).
The March 2020 recession followed a pandemic, an event the curve could not have been signalling in 2019. We keep that hit in the count, but it should be read with that in mind.
How long is the delay from an inverted yield curve to recession?
Long and uneven: from 9 to 23 months in the hits, and 34 months for the 1998 spell. Of the eight hits, only two, at 9 and 10 months, came within a year. The delay for the 10-year minus 3-month spread was shorter, with a mean of 12.5 months against 21.4 for the 10-year minus 2-year including the 1998 spell.
How much do our definitions change the answer?
A lot, which is a finding in itself. The table lists the main variants.
| Spread | Threshold (pp) | Min. months in a row | Window (months) | Spells | Followed by recession | Recessions | Preceded by a spell start |
|---|---|---|---|---|---|---|---|
| 10Y-2Y | 0 | 1 | 12 | 6 | 0 | 6 | 0 |
| 10Y-2Y | 0 | 1 | 24 | 6 | 4 | 6 | 4 |
| 10Y-2Y | 0 | 1 | 36 | 6 | 5 | 6 | 5 |
| 10Y-2Y | 0 | 3 | 24 | 5 | 4 | 6 | 4 |
| 10Y-2Y | -0.25 | 1 | 24 | 4 | 3 | 6 | 3 |
| 10Y-2Y | -0.5 | 1 | 24 | 2 | 1 | 6 | 1 |
| 10Y-3M | 0 | 1 | 12 | 5 | 2 | 4 | 2 |
| 10Y-3M | 0 | 1 | 24 | 5 | 4 | 4 | 4 |
| 10Y-3M | 0 | 3 | 24 | 5 | 4 | 4 | 4 |
| 10Y-3M | -0.25 | 1 | 24 | 4 | 3 | 4 | 3 |
| 10Y-3M | -0.5 | 1 | 24 | 3 | 2 | 4 | 2 |
Three points stand out. First, the 12-month window almost never works: the 10-year minus 2-year spread had no spell followed by a recession within a year, and the 10-year minus 3-month spread two of five. Second, requiring three consecutive inverted months removes the 1998 blip and changes little else. Third, demanding a deeper inversion removes false alarms but also removes recessions: at minus 0.5 points the 10-year minus 2-year spread leaves two spells and one hit.
Widening the window to 36 months lifts the 10-year minus 2-year result to five of six spells. That is the tradeoff: the longer the window, the more spells are rescued, and the less the signal says about timing.
How well does the spread score on a month-by-month test?
The AUC puts the numbers on the same footing as published work. For the 10-year minus 3-month spread on the full sample, the score was 0.81 for recessions 12 months ahead1, 0.65 at 6 months and 0.86 at 18 months. For the 10-year minus 2-year spread the scores were 0.69, 0.82 and 0.85.16
Restricted to data up to December 2019, the 12-month scores rose to 0.87 and 0.85, close to the 0.85 to 0.89 that Bauer and Mertens found for 1972 to 2018.3 From 1990 on they were lower, 0.77 and 0.75. The signal was strong in the older data and weaker in the sample that includes the 2022 spell.
| Spread | Sample | 6 months ahead | 12 months ahead | 18 months ahead |
|---|---|---|---|---|
| 10Y-3M | Full sample | 0.65 | 0.81 | 0.86 |
| 10Y-3M | To 2019-12 | 0.71 | 0.87 | 0.91 |
| 10Y-3M | From 1990-01 | 0.62 | 0.77 | 0.82 |
| 10Y-3M | Excluding 2020 | 0.64 | 0.81 | 0.87 |
| 10Y-2Y | Full sample | 0.69 | 0.82 | 0.85 |
| 10Y-2Y | To 2019-12 | 0.72 | 0.85 | 0.88 |
| 10Y-2Y | From 1990-01 | 0.57 | 0.75 | 0.83 |
| 10Y-2Y | Excluding 2020 | 0.69 | 0.82 | 0.85 |
Dropping the 2020 months moves the 10-year minus 3-month 12-month score from 0.81 to 0.81 and the 18-month score from 0.86 to 0.87, so the pandemic does not drive the result. A score near 0.8 is useful but not decisive: it is far above chance and well below perfect.
What happens to growth and jobs after a yield curve inversion?
Using quarters from 1982, we compared real GDP growth over the next four quarters across three states of the 10-year minus 3-month spread. After an inverted quarter, growth averaged 1.4 percent10 (20 quarters), against 2.9 percent after a flat curve and 3.0 percent after a normal one.10 The median after an inversion was 2.2 percent, so the average is pulled down by a few deep falls, the lowest being minus 7.4 percent.
Unemployment tells a similar story. In the 12 months after an inverted month, the unemployment rate rose by 1.02 percentage points on average, against 0.02 after a flat month and a fall of 0.36 after a normal month. But the share of months with a rise of 1 point or more was 21 percent after both inverted and flat months, and 7 percent after normal months.11 An inversion shifts the odds. It does not seal the outcome.
| Curve state (10Y-3M) | Quarters | Mean next-4-quarter GDP growth (%) | Median (%) | Lowest (%) |
|---|---|---|---|---|
| Inverted (below 0) | 20 | 1.4 | 2.2 | -7.4 |
| Flat (0 to 1) | 39 | 2.9 | 2.8 | -2.5 |
| Normal (1 or more) | 115 | 3.0 | 3.0 | -4.0 |
Is an inverted yield curve better than chance?
A fair worry is that recessions are common enough that any signal looks good. So we computed a base rate. From every month in our data that has 24 months of recession data after it, we asked whether a recession started in the next 24 months. For the 10-year minus 2-year spread the answer was yes in 24 percent of all months. After an inverted month it was 65 percent (99 months), and after a non-inverted month 15 percent (481 months).
For the 10-year minus 3-month spread the figures were 19 percent for all months, 55 percent after an inverted month (51 months) and 15 percent after a non-inverted month (462 months). So inversion multiplies the odds by roughly four of a recession start within two years compared with a normal curve. That is a large shift. It is also far from certainty: in the 10-year minus 3-month data, nearly half of inverted months were not followed by a recession start within 24 months, and those months are heavily concentrated in the 2022 spell.
| Spread | Any month | After inverted month | After non-inverted month |
|---|---|---|---|
| 10Y-2Y | 24% | 65% (n=99) | 15% (n=481) |
| 10Y-3M | 19% | 55% (n=51) | 15% (n=462) |
Does a longer or deeper inversion mean a bigger warning?
The idea that deeper is worse has support in intuition but not in our data. The 1998 blip lasted one month and reached only minus 0.02 points. The 1989 spell of the 10-year minus 2-year spread reached minus 0.32 and was followed by the 1990 recession, and the 2006 spell reached minus 0.15 before the 2008 recession. The 1978 spell was far deeper, at minus 2.14 points in March 1980, and ran for 39 inverted months, but the 1980 recession it preceded was short.
The 2022 spell stands out in depth and length. For the 10-year minus 3-month spread it ran 30 inverted months and reached minus 1.73 points, against 5 to 10 months and minus 0.16 to minus 0.70 in the four earlier spells. If depth and length measured the size of a coming downturn, that spell would have been the strongest warning in the sample. So far, the opposite has happened. We read this as a reason to doubt that the size of the inversion carries much information, with only five spells to judge from.
| Spread | Spell start | Inverted months | Deepest monthly mean (pp) | Month of deepest |
|---|---|---|---|---|
| 10Y-2Y | 1978-09 | 39 | -2.14 | 1980-03 |
| 10Y-2Y | 1989-01 | 9 | -0.32 | 1989-03 |
| 10Y-2Y | 1998-06 | 1 | -0.02 | 1998-06 |
| 10Y-2Y | 2000-02 | 11 | -0.41 | 2000-04 |
| 10Y-2Y | 2006-02 | 13 | -0.15 | 2006-11 |
| 10Y-2Y | 2022-07 | 26 | -0.93 | 2023-07 |
| 10Y-3M | 1989-06 | 5 | -0.16 | 1989-06 |
| 10Y-3M | 2000-07 | 7 | -0.70 | 2000-12 |
| 10Y-3M | 2006-08 | 10 | -0.52 | 2007-03 |
| 10Y-3M | 2019-05 | 6 | -0.36 | 2019-08 |
| 10Y-3M | 2022-11 | 30 | -1.73 | 2023-05 |
Did the record differ before and after 2000?
We split the spells at the year 2000. For the 10-year minus 2-year spread, two of three spells that began before 2000 and two of three that began in 2000 or later were followed by a recession within 24 months. For the 10-year minus 3-month spread the single pre-2000 spell was a hit and three of four later spells were. With counts this small, a split shows nothing beyond that the record is not worse in the later years until the 2022 spell is added.
Is the yield curve still inverted when a recession starts?
Here is a detail that often gets lost. In each of the four recessions of the 10-year minus 3-month data, the curve had already un-inverted by the time the recession began. The last inverted month came 8 months before the 1990 start, 3 before 2001, 8 before 2008 and 1 before 2020. In the start month the spread was positive each time, between 0.57 and 1.17 points.
| Recession start | Last inverted month before it | Months before start | Spread in start month (pp) | Fed funds in start month (%) |
|---|---|---|---|---|
| 1990-08 | 1989-12 | 8 | 1.06 | 8.13 |
| 2001-04 | 2001-01 | 3 | 1.17 | 4.80 |
| 2008-01 | 2007-05 | 8 | 0.92 | 3.94 |
| 2020-03 | 2020-02 | 1 | 0.57 | 0.65 |
What came before the inversions?
Every 10-year minus 3-month spell was preceded by a rise in the policy rate. The federal funds rate in the month the spell started was higher than 12 months earlier by 2.02 points in 1989, 1.55 in 2000, 1.75 in 2006, 0.69 in 2019 and 3.70 in 2022. That fits Wright, whose work found that adding the level of the policy rate improves the forecast.85 It also fits the Bauer and Mertens note that the curve can invert for two reasons: tight policy slowing activity, or investors expecting a downturn.3
What happened after the 2022 inversion?
This is the live test. The 10-year minus 2-year spread was inverted in 26 months, from July 2022 to August 2024, with its deepest monthly mean at minus 0.93 points in July 2023. The 10-year minus 3-month spread was inverted in 30 months, from November 2022 to August 2025, and reached minus 1.73 points in May 2023. On daily data, the 10-year minus 2-year spread was negative on 541 days to 5 September 2024, and the 10-year minus 3-month spread on 621 days to 16 October 2025.
- 1978-09First 10Y-2Y inversion spell of our sample beginsSource 6 (opens the source in a new tab)
- 2019-03-22First negative daily reading of 10Y-3M before the 2020 recessionSource 1 (opens the source in a new tab)
- 2020-03Recession start month in the NBER-based indicatorSource 7 (opens the source in a new tab)
- 2022-04-01First negative daily 10Y-2Y reading of the latest spellSource 6 (opens the source in a new tab)
- 2022-10-18First negative daily 10Y-3M reading of the latest spellSource 1 (opens the source in a new tab)
- 2024-09-05Last negative daily 10Y-2Y readingSource 6 (opens the source in a new tab)
- 2025-10-16Last negative daily 10Y-3M readingSource 1 (opens the source in a new tab)
What did the economy do? Unemployment hit a low of 3.4 percent in April 2023, reached a high of 4.5 percent in November 2025, and stood at 4.2 percent in September 2026. The lowest year-over-year growth in real GDP since the start of 2022 was 1.2 percent in the fourth quarter of 2022. The federal funds rate peaked at 5.33 percent in August 2023 and was 3.75 percent in September 2026.11108
In the four earlier 10-year minus 3-month spells, a recession started 1 to 8 months after the last inverted month. Since the last inverted month in August 2025 there have been 13 months of data with no recession. That does not prove the signal broke. The older spells were also followed by recessions of different causes, and NBER dating comes with a lag. It does mean that on current data the 2022 spell is a miss under every window we tried up to 36 months.
How do the strongest objections hold up?
Four objections come up often. We take each in turn and say what our numbers can and cannot answer.
First: the sample is too small to mean anything. This is partly right. With four to six recessions and five or six spells, we cannot give a precise probability. What we can say is that the month-level tests use hundreds of months and agree with the spell-level tests in direction: inversion raises the odds of a recession start within two years from about 15 percent to between 55 and 65 percent. But months overlap, so the effective sample is still the handful of episodes.
Second: the 2020 recession was a pandemic, so it should not count. We tested this. Dropping the 2020 months leaves the 12-month score for the 10-year minus 3-month spread at 0.81, the same as before. The signal does not rest on that one case. It does mean that the timing of the 2020 hit was luck rather than information.
Third: central bank bond buying has distorted long yields, so the old rule no longer applies. Our data cannot settle this. The 2022 spell is consistent with it, and so is a very long lead time. Bauer and Mertens looked at term premium adjustments and found they did not improve the forecast, which argues against ignoring the raw spread.3 Engstrom and Sharpe argue that the near-term forward spread is a cleaner signal, and that is a measure we did not build.4
Fourth: the curve might itself cause the downturn, because banks borrow short and lend long, and a flat or inverted curve squeezes their margins. We did not test this and the data cannot tell. Bauer and Mertens write that causation may well have gone both ways.3 We simply note that, in the 10-year minus 3-month data, the curve had already turned positive by the time every recession began, which does not look like a tight squeeze on lenders at that moment.
What do the findings add up to?
Against our two tests, the claim is partly supported. Coverage passed: five of six recessions for the 10-year minus 2-year spread, and all four for the 10-year minus 3-month spread, had an inversion in the prior 24 months. The spell hit rate was four of six and four of five, about two thirds to four fifths, and it falls to one half or below under tighter definitions. The 10-year minus 3-month version scored slightly better and gave a shorter lead, as we expected. The hypothesis that the signal is useful but not perfect is what the data show.
Why might the 2022 spell differ?
- The policy rate rose by 3.70 points in the 12 months before the spell, the largest rise of any spell here, so the curve may have been inverted by the speed of tightening more than by expected weakness.
- The federal funds rate was 0.08 percent 12 months before the spell began, so the starting point was unusually low.
- Some argue that quantitative easing pushed long yields down; Bauer and Mertens call that plausible but uncertain, and see no clear evidence that this time is different.
- The sample of spells is tiny, so one miss lowers the hit rate a lot.
Limitations
What limits these results?
The sample is tiny: six recessions and five or six spells since 1976, so one miss changes the hit rate a lot. At six spells, a change of one moves the rate by 17 points. Our figures describe the data, and cannot support a statement about the true probability.
The method is flexible. Different rules for what counts as a spell, a 12-month gap, a threshold or a window would give different counts, and our robustness table shows that the answer moves between zero and five of six depending on the window. The monthly average rule missed the brief 2019 dip in the 10-year minus 2-year spread, which the daily rule picks up.
Recession dates come from a committee that announces after the fact. The latest period could still be revised, and a recession starting late in our data would not yet show. We also did not test the claim that the curve causes recessions. Inversion may reflect expected rate cuts, tight policy, a flight to safety, or all three.
We did not control for the rate of inflation, the size of the central bank balance sheet, or the changing makeup of Treasury buyers. The GDP and unemployment comparisons use overlapping windows, so the 20 inverted quarters are not 20 independent observations. We did not fit probit models or out-of-sample forecasts like the published papers.
Is the 2022 spell a true miss, a very long lead, or evidence that quantitative easing and policy settings changed what an inversion means?
Conflicts
Conflicts of interest
The Realigned has no commercial relationship with the Federal Reserve Bank of St. Louis, the National Bureau of Economic Research, the Federal Reserve Banks that wrote the papers we cite, or any bond market firm. The analysis was done by The Realigned. The question and the 24-month window were fixed before we opened the data. Where we later added variants, they are labelled in the robustness table.
Sources
- 110-Year Treasury Constant Maturity Minus 3-Month Treasury Constant Maturity (T10Y3M) (opens the source in a new tab) · FRED, 2026 · Dataset · https://fred.stlouisfed.org/series/T10Y3M
- 2The Yield Curve as a Predictor of U.S. Recessions (opens the source in a new tab) · Federal Reserve Bank of New York, Current Issues in Economics and Finance 2(7), 1996 · Paper · https://www.newyorkfed.org/research/current_issues/ci2-7.html
- 3Information in the Yield Curve about Future Recessions (opens the source in a new tab) · Federal Reserve Bank of San Francisco, Economic Letter 2018-20, 2018 · Report · https://www.frbsf.org/wp-content/uploads/el2018-20.pdf
- 4The Near-Term Forward Yield Spread as a Leading Indicator: A Less Distorted Mirror (opens the source in a new tab) · Federal Reserve Board, FEDS 2018-055, 2018 · Paper · https://www.federalreserve.gov/econres/feds/files/2018055pap.pdf
- 5The Yield Curve and Predicting Recessions (opens the source in a new tab) · Federal Reserve Board, FEDS 2006-07, 2006 · Paper · https://www.federalreserve.gov/pubs/feds/2006/200607/200607pap.pdf
- 610-Year Treasury Constant Maturity Minus 2-Year Treasury Constant Maturity (T10Y2Y) (opens the source in a new tab) · FRED, 2026 · Dataset · https://fred.stlouisfed.org/series/T10Y2Y
- 7NBER based Recession Indicators for the United States from the Period following the Peak through the Trough (USREC) (opens the source in a new tab) · FRED, 2026 · Dataset · https://fred.stlouisfed.org/series/USREC
- 8Federal Funds Effective Rate (FEDFUNDS) (opens the source in a new tab) · FRED, 2026 · Dataset · https://fred.stlouisfed.org/series/FEDFUNDS
- 9Federal Reserve Statistical Release H.15: Selected Interest Rates (opens the source in a new tab) · Federal Reserve Board, 2026 · Primary source · https://www.federalreserve.gov/releases/h15/
- 10Real Gross Domestic Product (GDPC1) (opens the source in a new tab) · FRED, 2026 · Dataset · https://fred.stlouisfed.org/series/GDPC1
- 11Unemployment Rate (UNRATE) (opens the source in a new tab) · FRED, 2026 · Dataset · https://fred.stlouisfed.org/series/UNRATE
- 12Business Cycle Dating (opens the source in a new tab) · NBER, 2026 · Primary source · https://www.nber.org/research/business-cycle-dating
- 13US Business Cycle Expansions and Contractions (opens the source in a new tab) · NBER, 2026 · Primary source · https://www.nber.org/research/data/us-business-cycle-expansions-and-contractions
Plain-language version
The short version
Usually, governments pay more to borrow for ten years than for three months. Sometimes that flips, and people call it an inverted yield curve. In our data, a flip came before every US recession since 1990, with warnings that arrived 9 to 17 months ahead. But a flip that began in 2022 had not been followed by a recession by September 2026. A flip is a signal that has often been right, not a certainty, and it does not say what causes the slowdown.
Key takeaways
- The 10-year minus 3-month spread inverted before all four recessions since 1990, but one was the 2020 pandemic.
- Four of six 10-year minus 2-year spells were followed by a recession within 24 months.
- A month-by-month score of 0.81 shows the signal is useful, well above chance and well below perfect.
- The spell that began in 2022 has not been followed by a recession in the data, and the answer depends on the window.