- Place
- Korean peninsula (North Korea and South Korea)
- Years
- 1953–2025
- Policy
- North Korea built a state-run economy centred on heavy industry and defence; South Korea adopted state-guided, export-led capitalism from the early 1960s.
- Outcome
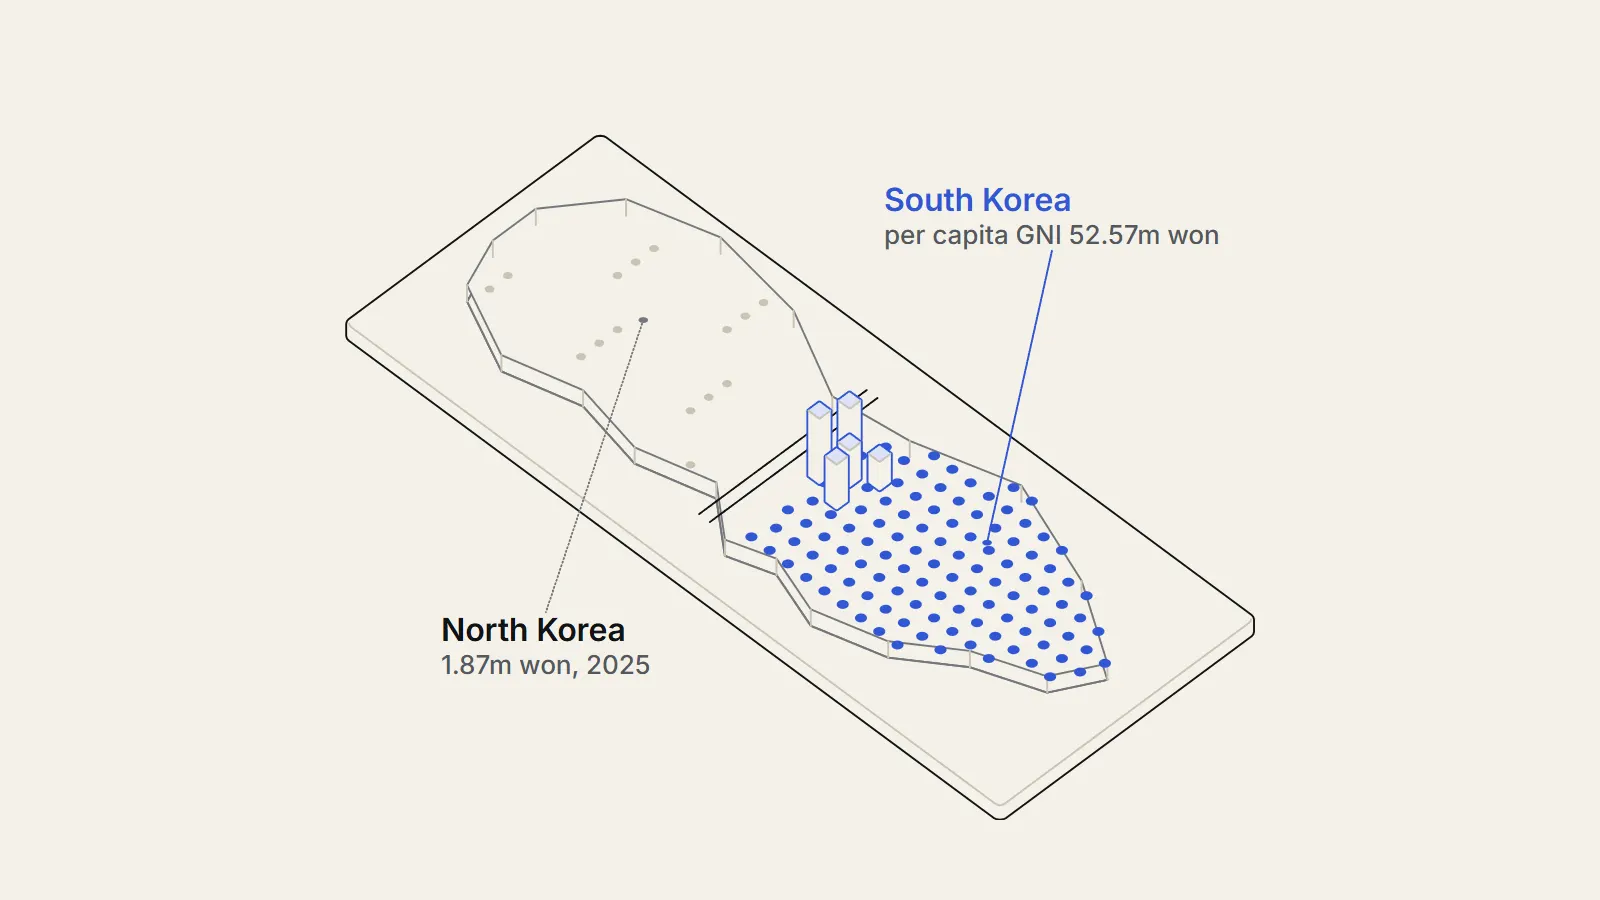
- By 2022 South Korean GDP per capita was about 26 times the Maddison estimate for the North; the Bank of Korea puts North Korea per capita GNI in 2025 at about one twenty-eighth of the South.
The North Korea vs South Korea economy gap is one of the largest between two neighbours in modern history. The peninsula was split in 1945 and fought a war from 1950 to 1953; by 2022 South Korean GDP per capita was about 26 times the Maddison Project estimate1 for the North, and in 2025 the Bank of Korea put North Korea's per capita gross national income at roughly one twenty-eighth of the South's2.12 This piece looks at how the two economies started, what each government chose to do, and how much of the gap those choices can explain.
Before
Was North Korea once richer than South Korea? The inheritance of 1945
Korea's two halves were not alike when the peninsula was divided. The Library of Congress country study on North Korea says Japan had built considerable heavy industry in the north, especially in metals, chemicals, hydroelectric power and mining, while the south produced most of the rice and a majority of the textiles.4 The same study says the hydroelectric and chemical plants in the north were said to be second to none in Asia at the time.4 The Council on Foreign Relations adds that the north held about 80 percent of the peninsula's coal and minerals and most of its heavy machinery.5
That industry was limited in one important way. Northern heavy industry mostly produced raw materials, semifinished goods and war supplies for finishing in Japan, and Japan did not allow a machine tool industry to develop.4 Partition then cut the industrial north from the agricultural south and from Japanese markets, severing North Korea's traditional markets and food sources. The war of 1950 to 1953 devastated industrial plants.4
The south's starting point was a rural economy: toward the end of Japanese rule about 50 percent of Korean farm households were headed by tenant farmers.4 South Korea's income per head in 1953 was about 1,317 international dollars at 2011 prices in the Maddison Project Database, rising to 1,548 by 1960, a gain of about 18 percent in seven years by our calculation.1
We found no comparable income estimate for North Korea in the 1950s. The Maddison series for the North begins only in 1990.1 Whether the two economies were of similar size in the 1950s and 1960s therefore cannot be checked with the data we could open, and we do not rely on that claim.
Divergence that began before the division
Andersson, Lopez Jerez and Miladinovic argue in the Journal of Institutional Economics that the economic gap between the northern and southern halves can be traced back to colonial rule, which treated the regions differently, especially after the mid-1920s.6 On that reading the two states did not start as mirror images, and the story begins before 1953.
Effectively, North Korea had a planned economy with no plan.
— CFR Education, Two Koreas, Two Development Policies, 2022
The decision
Two systems, two strategies
North Korea built a command economy. By 1958 industry had been fully socialised, and state-owned firms produced more than 90 percent of industrial output4 in the 1960s, according to the Library of Congress country study (https://countrystudies.us/north-korea/45.htm).4 The Council on Foreign Relations reports that in 1962 three-quarters of government investment went to heavy industry and weapons, and that the regime followed the principle of juche, or self-reliance, in practice relying on Soviet subsidies for energy and cheap machinery worth over 60 percent of GDP, by that source's account.5 North Korea defaulted on international loans in 1975.5
The CFR account is not uniformly negative about the early years: it says early industrialisation worked, but that heavy military spending and weak oversight of production caused inefficiency, and that losing Soviet support after 1991 deepened the crisis.5 By the 1980s the North Korean army reached about one million, which the same source puts at one-tenth of the male population.5
South Korea chose a different route under Park Chung-hee. The government launched a First Five-Year Economic Development Plan for 1962 to 1966 that emphasised electrification, fertilizers, oil refining, synthetic fibers and cement.7 Exports were encouraged, reversing the earlier policy of reliance on imports.7 Growth was financed by foreign loans and domestic bank credit, with the government guaranteeing repayment if a firm could not repay foreign creditors, which the Library of Congress calls guided capitalism.7
The Library of Congress study describes the arrangement as one in which government planners supplied the blueprints and the large family-owned conglomerates, the chaebol, carried them out. It says a government-led policy was necessary in the 1960s because private entrepreneurs lacked the capital for strategic industries.7 The state also created heavy industry directly. POSCO, the steel company, was founded in April 1968 with 39 employees and began production in 1972, with early financing that included US$73.7 million of Japanese government grants and loans and US$50 million of credit from the Japan Export-Import Bank.7 By 1987 the four largest chaebol had revenues of US$80.7 billion, about two-thirds of the country's GNP.7 In the mid-1970s exports increased by an average of 45 percent a year, and GNP rose fivefold between 1965 and 1978.7
Outside support differed too. Roughly 60,000 US troops were stationed in South Korea in the 1960s, and by 1970 the United States was its largest market, according to the Council on Foreign Relations.5 North Korea's external patrons were communist states, and the Library of Congress says the regime reoriented its economy mainly toward them.4
- 1945The peninsula is divided; industry mostly in the north, farmland mostly in the southSource 4 (opens the source in a new tab)
- 1950-53Korean War devastates industrial plantsSource 4 (opens the source in a new tab)
- 1958North Korean industry fully socialisedSource 4 (opens the source in a new tab)
- 1962Three-quarters of North Korean government investment goes to heavy industry and weaponsSource 5 (opens the source in a new tab)
- 1962-66South Korea's First Five-Year Economic Development PlanSource 7 (opens the source in a new tab)
- Apr 1968POSCO founded in South KoreaSource 7 (opens the source in a new tab)
- 1975North Korea defaults on international loansSource 5 (opens the source in a new tab)
- 1987South Korea becomes a democracySource 5 (opens the source in a new tab)
- 1993-98The gap in life expectancy between the Koreas widens from under 3 years to about 12Source 3 (opens the source in a new tab)
- Dec 1997IMF approves a US$21 billion stand-by credit for South KoreaSource 8 (opens the source in a new tab)
- May 2019FAO and WFP report the worst North Korean harvest in a decadeSource 9 (opens the source in a new tab)
- Jul 2026Bank of Korea estimates North Korean real GDP grew 3.5 percent in 2025Source 2 (opens the source in a new tab)
The strongest case against reading this as a test of two systems
the political and economic decisions their leaders made destined the countries for completely different futures
— CFR Education, Two Koreas, Two Development Policies, 2022
The South Korean model also had costs that its supporters accept. The IMF approved a US$21 billion stand-by credit on 4 December 1997 after highly leveraged conglomerates, or chaebols, went bankrupt in unprecedented numbers, nonperforming loans rose to about 7.5 percent of GDP and banks were weakly supervised.8 The IMF noted that the fundamentals had looked sound earlier in 1997, with growth of 6 percent in the first three quarters.8 The programme required the phasing out of the blanket deposit guarantee by the end of 2000, the suspension of nine insolvent merchant banks, independence for the Bank of Korea and trade liberalisation in line with WTO commitments.8 The World Bank indicated support of up to US$10 billion and the Asian Development Bank up to US$4 billion.8
World Bank data show the scale of the shock: South Korea's real GDP fell 4.9 percent in 1998.10 South Korea also became a democracy only in 1987, according to the Council on Foreign Relations, so for the first quarter-century of rapid growth the model operated without political competition.5 Those who defend the model say the growth bought the incomes that made later reform possible; critics say the state-credit system created the leverage that failed in 1997. Both claims fit the facts we have. The Library of Congress study itself notes that the government guaranteed repayment of foreign loans taken by firms, which meant the state stood behind the risks those firms ran.7
What happened
North Korea vs South Korea GDP per capita over time
In the Maddison Project Database, South Korean GDP per capita rose from 13,874 international dollars in 1990 to 41,321 in 2022, while the North Korean estimate fell from 2,456 to 1,569. By our calculation the ratio widened from about 5.6 to 1 in 1990 to about 26 to 1 in 2022.1 South Korea's income per head in 1960 was 1,548, so by 2022 it had risen about 27-fold.1
The Bank of Korea (https://www.bok.or.kr/eng/bbs/E0000634/view.do?nttId=11063397&oldMenuNo=400007&menuNo=400069&programType=newsDataEng&depth=400069&relate=Y) publishes its own estimates for the North, using South Korean prices and value-added ratios, and warns that they should not be compared directly with other countries' figures.2 On that basis North Korea's nominal gross national income in 2025 was 48.5 trillion won, about 1.8 percent of the South's, and per capita GNI was 1.87 million won, about 3.6 percent of the South's.2 The North has about half the South's population, 25.9 million against 51.7 million.2 Its economy is also more dependent on farming and heavy industry than the South's: in 2025 agriculture, forestry and fishing made up 21.2 percent of North Korean GDP, mining and manufacturing 30.1 percent and services 29.6 percent.2
| Measure | North Korea | South Korea |
|---|---|---|
| Nominal GNI | 48.5 trillion won | 2,717.1 trillion won |
| GNI per capita | 1.87 million won | 52.57 million won |
| Population | 25.9 million | 51.7 million |
| Trade (exports plus imports) | US$3.13 billion | US$1,341.2 billion |
| Exports | US$0.47 billion | US$709.3 billion |
| Real GDP growth | 3.5% | 1.1% (preliminary) |
Output in the North has not moved in one direction. The Bank of Korea lists real GDP growth of minus 4.3 percent in 1990 and minus 4.4 percent in 1995, then growth of 3.8 percent in 2005, and declines of 3.5 percent in 2017, 4.1 percent in 2018 and 4.5 percent in 2020. It estimates growth of 3.1 percent in 2023, 3.7 percent in 2024 and 3.5 percent in 2025, faster than the South in those years.2 External trade is small. North Korea's trade, exports plus imports, was US$3.13 billion in 2025, up 16.0 percent, made up of US$0.47 billion of exports and US$2.66 billion of imports, so the country bought abroad more than five times what it sold; South Korea's trade was US$1,341.2 billion.2 For 2024 the Bank of Korea reports construction up 12.3 percent and heavy and chemical industry up 10.7 percent, while agriculture shrank 1.9 percent.2 Manufacturing grew 6.6 percent in 2025, heavy and chemical industry 7.8 percent and construction 6.3 percent, and the Bank of Korea says there have been no goods transported between the two Koreas since 2023, down from US$31.3 million in 2018 and US$6.9 million in 2019.2 In the official count, direct trade between the two economies is therefore now zero, so the North's imports and exports in the table above are all with third countries.
What is North Korea's GDP per capita?
The Maddison Project Database puts North Korea's GDP per capita at 1,569 international dollars in 2022 (2011 prices), down from 2,456 in 1990.1 The Bank of Korea's own estimate for 2025 is gross national income of 1.87 million won per person, about 3.6 percent of the South's, and it warns that its figures should not be compared directly with other countries'.2
How the South grew
World Bank data for South Korea give real growth that averaged, by our calculation, 9.6 percent a year in 1961 to 1970, 9.4 percent in 1971 to 1980 and 10.2 percent in 1981 to 1990, then 7.3 percent in 1991 to 2000, 4.7 percent in 2001 to 2010 and 2.7 percent in 2011 to 2024.10 Annual growth peaked at 15.0 percent in 1973, fell 1.5 percent in 1980 and was 2.0 percent in 2024.10 The slowdown is what usually happens as a richer economy catches up with the technology frontier, but the sources we opened do not test that explanation.
Living standards and food in the North
Income figures understate the human gap. Khang reports that the life expectancy gap between the Koreas was under three years in 1993 and about 12 years by 19983, and has stayed there.3 Estimates of deaths in the food crisis of the 1990s run from roughly 240,000 to 600,000, based on North Korean census data from 1993 and 2008, and infant mortality in 2010 was about seven times higher in the North.3
Food remains a problem. In 2019 FAO and the World Food Programme reported that about 10.1 million people faced severe food shortages after a harvest of 4.9 million tonnes, the lowest since 2008/09, leaving an uncovered deficit of 1.36 million tonnes after counting commercial import capacity.9 The public distribution system, which rations food, was cut to the lowest level ever recorded for that time of year, and wheat, barley and potato output fell by about 20 percent.9 A United Nations information centre cited the World Food Programme in August 2026 as estimating that around 10.7 million people, more than 40 percent of the population, are undernourished.11
What economists still disagree on
What explains the gap, and what cannot be known
The Council on Foreign Relations argues that the choices of the two leaders, not the starting conditions, set the countries on different paths, and describes the North Korean economy as a planned economy with no plan.5 Andersson and co-authors argue that part of the gap is rooted in differences that predate partition.6 The two views are not exclusive, but they put the weight in different places, and the evidence we opened does not allow a split of the gap into shares.
The data are weak in places. The only series for the North's national accounts are estimates, and the Bank of Korea itself says its figures should not be compared directly with other countries.2 The Maddison series for the North starts in 1990, so we cannot compare the two economies in the 1950s and 1960s.1 The famine death estimates depend on North Korean census data, and the range is wide, from 240,000 to 600,000.3
Even simple claims vary between sources. The Council on Foreign Relations states that South Korea's growth exceeded 10 percent throughout the 1970s.5 The World Bank annual series averages 9.4 percent for 1971 to 1980 and has a fall of 1.5 percent in 1980.10 The difference is small, but it is a reminder of why we prefer the primary series where we can find it.
The strength of our sources also differs. The Bank of Korea release, the World Bank series, the IMF press release and the Library of Congress studies are official or institutional records. The Council on Foreign Relations piece is an education explainer written by staff and not a research paper, and the life expectancy and famine figures come from a short published response letter that reports ranges and relies on census data from North Korea.53 We have used the stronger sources for numbers and the weaker ones only for attributed claims.
- Agreed in the sources: the south grew rapidly from the 1960s and the north's output per head fell in the 1990s and has stayed low.
- Disputed: how much of the divergence comes from colonial-era differences, from policy and from outside support.
- Disputed: the human cost of the 1990s food crisis, with estimates from 240,000 to 600,000 deaths.
- Not known: North Korea's true national accounts, and how the two economies compared in the 1950s.
If the north had kept its early industrial advantage and the south had not adopted export-led growth, would the two economies have diverged anyway, and in which direction?
Lessons
Key takeaways
- The gap is very large. In 2022 South Korean income per head was about 26 times the Maddison estimate for the North, and the Bank of Korea's 2025 figure for per capita GNI is about 28 times.
- The two economies did not start identical. The north had heavy industry and resources; the south had farmland and people. The comparison is not a clean experiment.
- The South combined state direction with exports. Policy included five-year plans, directed credit, guarantees and state-founded industry, so it is not a case of the state staying out.
- The numbers for the North are estimates. Treat any single figure for North Korean output with caution, including ours.
What carries over is the pattern in which the South tied support for firms to export performance and exposed them to foreign markets, whereas the North tied production to state targets and a small group of partners.7 The sources we opened describe this as a contrast in strategy, though none proves it caused the gap on its own. The sources agree more on the direction of travel than on the reasons for it. What does not carry over is the exact setting: a US security guarantee, a late-colonial history that differed between north and south.56
Sources
- 1Maddison Project Database 2023: GDP per capita (international-$ in 2011 prices), North Korea and South Korea (opens the source in a new tab) · Maddison Project, Groningen Growth and Development Centre; data file via Our World in Data, 2023 · Dataset · https://ourworldindata.org/grapher/gdp-per-capita-maddison-project-database
- 2Gross Domestic Product Estimates for North Korea in 2025 (press release, July 31, 2026) (opens the source in a new tab) · Bank of Korea, Economic Statistics Department, 2026 · Primary source · https://www.bok.or.kr/eng/bbs/E0000634/view.do?nttId=11063397&oldMenuNo=400007&menuNo=400069&programType=newsDataEng&depth=400069&relate=Y
- 3Author's Response to: Two Koreas and public health: 'First, do no harm' (opens the source in a new tab) · International Journal of Epidemiology, 43(4), 1341-1342, 2014 · Paper · https://pmc.ncbi.nlm.nih.gov/articles/PMC4258768/
- 4North Korea: Economic Setting (Library of Congress Country Study) (opens the source in a new tab) · Library of Congress (hosted at countrystudies.us), 1993 · Primary source · https://countrystudies.us/north-korea/45.htm
- 5Two Koreas, Two Development Policies (opens the source in a new tab) · Council on Foreign Relations, 2022 · Report · https://www.cfr.org/education/learn/reading/two-koreas-two-development-policies
- 6Divergence before the division: the colonial origins of separate development paths in Korea (opens the source in a new tab) · Journal of Institutional Economics, vol. 19, issue 6, pp. 802-819, 2023 · Paper · https://www.cambridge.org/core/journals/journal-of-institutional-economics/article/divergence-before-the-division-the-colonial-origins-of-separate-development-paths-in-korea/2A2F0406E417EC3F8807860F8487230E
- 7South Korea: The Government Role in Economic Development; and The Government and Public and Private Corporations (Library of Congress Country Study) (opens the source in a new tab) · Library of Congress (hosted at countrystudies.us), 1990 · Primary source · https://countrystudies.us/south-korea/47.htm
- 8IMF Approves SDR 15.5 Billion Stand-By Credit for Korea (Press Release 97/55) (opens the source in a new tab) · IMF, 1997 · Primary source · https://www.imf.org/en/News/Articles/2015/09/14/01/49/pr9755
- 9After worst harvest in ten years, 10 million people in North Korea face imminent food shortages (opens the source in a new tab) · Food and Agriculture Organization of the United Nations, 2019 · Primary source · https://www.fao.org/newsroom/detail/After-worst-harvest-in-ten-years-10-million-people-in-North-Korea-face-imminent-food-shortages/en
- 10World Development Indicators: GDP growth (annual %), Republic of Korea, 1961 to 2024 (opens the source in a new tab) · World Bank Open Data, 2026 · Primary source · https://api.worldbank.org/v2/country/KOR/indicator/NY.GDP.MKTP.KD.ZG?format=json&date=1961%3A2024
- 11North Korea: 40% of the population is undernourished (opens the source in a new tab) · United Nations Western Europe (UNRIC), 2026 · Report · https://unric.org/en/north-korea-40-of-population-is-undernourished/