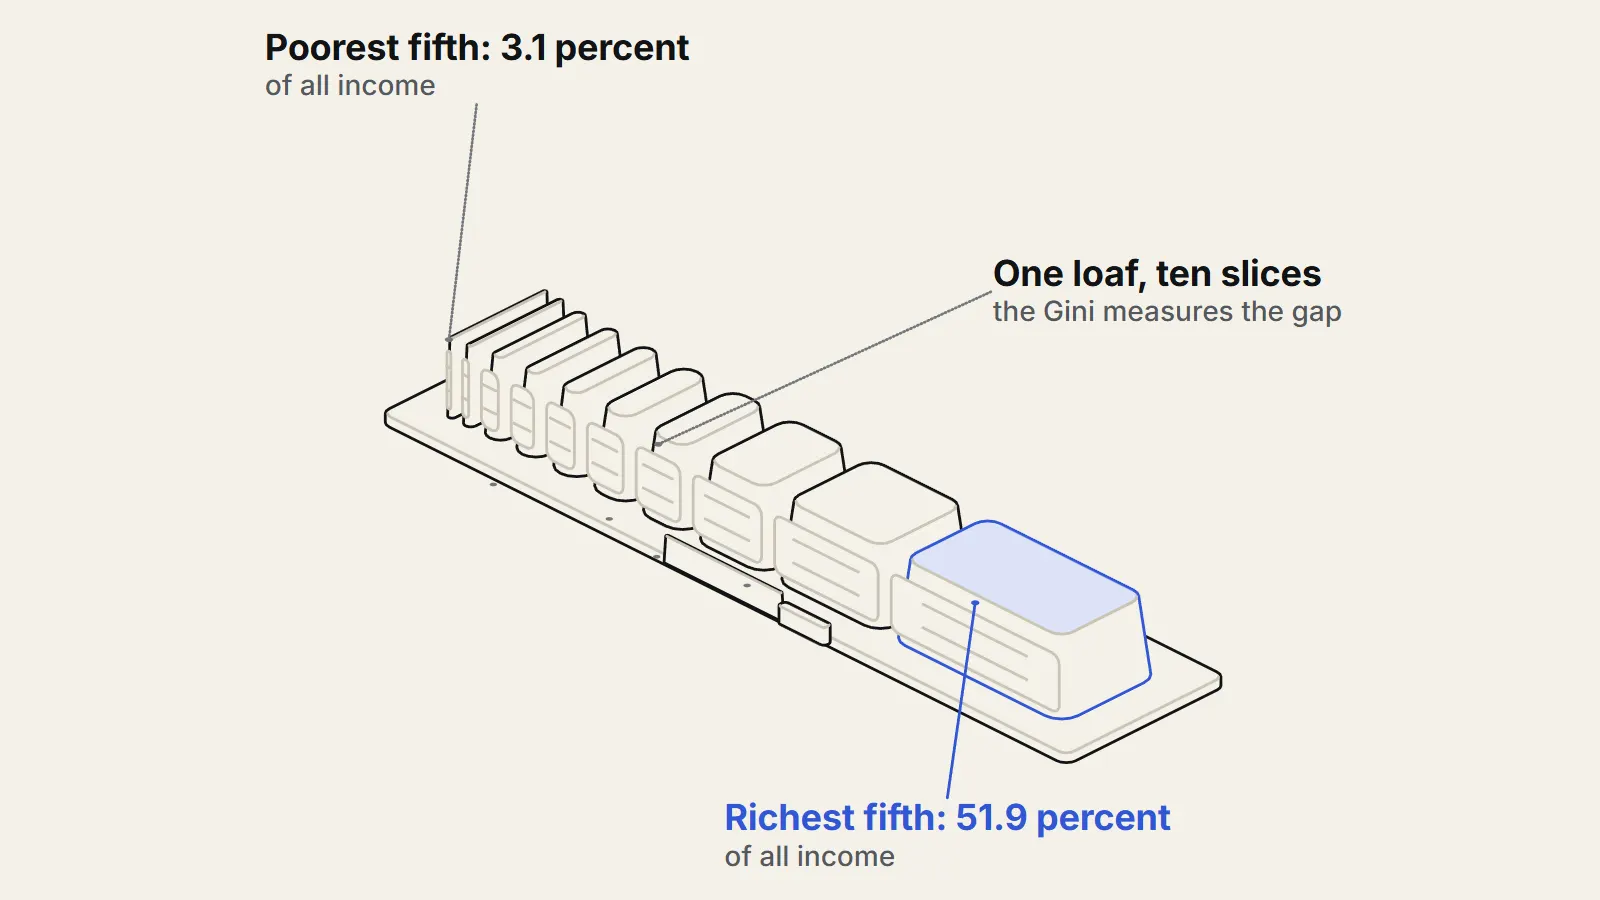
The Gini coefficient is the most widely used single number for inequality. It runs from 0, where everyone has the same income, to 1, where one person has everything, and it summarises how far apart incomes are across a whole population. That compactness is its strength and its weakness: the Gini coefficient lets you compare countries and years quickly, but two very different income distributions can produce the same number. This piece explains how it is computed, what US figures look like, and what the Gini leaves out.
How is the Gini coefficient computed?
The US Census Bureau describes the Gini index as a statistical measure ranging from 0.0 to 1.0 that captures how much any two incomes differ, on average, relative to the mean income.1 Picture picking two people at random and comparing their incomes. If the typical gap is large compared with the average income, the Gini is high.
A second way to see it uses the Lorenz curve. Line up everyone from poorest to richest and plot the share of total income held by the bottom 10 percent, the bottom 20 percent, and so on. With perfect equality the plot is a straight diagonal. In real societies it sags below the diagonal. The World Bank defines the Gini (https://databank.worldbank.org/metadataglossary/environment-social-and-governance-(esg)-data/series/SI.POV.GINI) as the area between this Lorenz curve and the line of perfect equality, and the Census Bureau gives the same picture.23 The bigger the sag, the higher the Gini.
A tiny illustration shows the arithmetic. Take four households with incomes of 10, 20, 30 and 40, so the mean is 25. Compare every pair of households in both orders (16 ordered pairs, including each household with itself), add up the gaps, and divide by twice the number of households squared times the mean. That gives 0.25. If the same total, 100, went entirely to one household and the others got nothing, the result would be 0.75, which is the highest value possible with four households. This example is made up for illustration, not data.
What does the Gini coefficient show for the United States?
The Census Bureau reports a Gini index of 0.485 for US household money income in 20231, with no statistically significant change from 2022.1 In the same report, the poorest fifth of households received 3.1 percent of all household income, the richest fifth received 51.9 percent, and the top 5 percent received 23.0 percent.1
The figure depends on what you count as income. The headline measure is money income before taxes and without in-kind benefits. When the Census Bureau subtracts federal, state and local income taxes, payroll taxes and credits, the Gini for 2023 falls to 0.442, which it describes as 8.9 percent lower than the pretax figure.1 Adjusting for household size gives another number: the Bureau reports an equivalence-adjusted Gini of 0.465 for 2023, compared with 0.485 for unadjusted money income, because the adjustment takes household size into account, and small households are concentrated at the lower end of the income distribution.1 So the same country in the same year has at least three Gini values, and none of them is wrong. They answer different questions.
What does the Gini hide?
The first limit is that different distributions can share one Gini. The World Bank notes that Gini coefficients are not unique: the same value can come from different Lorenz curves.2 A study of 3,056 US counties by Kristin Blesch, Oliver Hauser and Jon Jachimowicz makes this concrete. Putnam County, Ohio and Chambers County, Texas both had a Gini of about 0.46, yet the top 10 percent held 38.7 percent of income in Putnam and 32.1 percent in Chambers.4 The Gini cannot tell you whether inequality is mainly about a very rich top or about a stretched-out bottom.
That matters in practice. In the same study (https://pmc.ncbi.nlm.nih.gov/articles/PMC7614289/), the Gini showed no significant relationship with obesity across counties, but two separate measures that split bottom-heavy from top-heavy inequality did, and they pointed in opposite directions.4 A single number can wash out effects that cancel.
The second limit is about data. The World Bank warns that its inequality data are not strictly comparable across countries, or even across years within a country, because the underlying surveys differ. Some measure income and others measure consumption, and it says consumption is usually a better welfare indicator, particularly in developing countries.2 It also says country-level Gini coefficients cannot be aggregated into regional or global ones.2 A ranking of countries by Gini is therefore less exact than it looks.
The third limit is that the Gini describes a snapshot of incomes, not lives. It does not record whether the same people are poor year after year or whether people move up and down. It says nothing about wealth, public services such as schools and health care, or how far prices differ between regions. Those gaps are limitations of the measure, not flaws in the Census or World Bank work. The sources used here do not quantify them.
Is the Gini still the right tool?
The fair case for the Gini is that it is simple, widely understood and consistently calculated over long periods, which is why the Census Bureau and the World Bank both publish it. The Census Bureau itself does not rely on it alone; it also reports percentile ratios, quintile shares and other measures such as the Theil index and Atkinson measures.1 The researchers behind the county study argue that focusing on the Gini alone can obscure effects, and that a two-parameter description of the distribution can clear up findings that conflict.4
What is not known?
The sources here do not say which single measure best captures what the public cares about, and that is partly a question of values rather than data. The county study is US-only and correlational, so it does not show that the pattern of inequality causes any outcome, and its authors say the details of its method should be treated as specific to the dataset.4
The practical advice is to ask three things whenever you see a Gini: before or after taxes, adjusted for household size or not, and based on income or consumption. Then look at the shares of the top and bottom groups before drawing a conclusion.
Key takeaways
- The Gini coefficient runs from 0 (everyone equal) to 1 (one person has all the income) and measures how far apart incomes are on average relative to the mean.
- The US money-income Gini was 0.485 in 2023; after taxes and credits it was 0.442, which is 8.9 percent lower, and the size-adjusted figure was 0.465.
- Different income distributions can share one Gini: two US counties at about 0.46 had top-10-percent shares of 38.7 and 32.1 percent.
- Cross-country comparisons are looser than they look because surveys differ in method and in whether they measure income or consumption.
- Check what the number covers (pre or post tax, household size, income or consumption) and read it alongside income shares.
Sources
- 1Income in the United States: 2023 (Report P60-282) (opens the source in a new tab) · U.S. Census Bureau, 2024 · Report · https://www.census.gov/library/publications/2024/demo/p60-282.html
- 2Gini index (World Bank estimate) - metadata (SI.POV.GINI) (opens the source in a new tab) · World Bank DataBank, 2026 · Dataset · https://databank.worldbank.org/metadataglossary/environment-social-and-governance-(esg)-data/series/SI.POV.GINI
- 3Gini Index (opens the source in a new tab) · U.S. Census Bureau, 2021 · Primary source · https://www.census.gov/topics/income-poverty/income-inequality/about/metrics/gini-index.html
- 4Measuring inequality beyond the Gini coefficient may clarify conflicting findings (opens the source in a new tab) · Nature Human Behaviour 6(11), 1525-1536, 2022 · Paper · https://pmc.ncbi.nlm.nih.gov/articles/PMC7614289/